Best of Tableau Web: May 2021


Welcome to our monthly highlight of data viz tips, tricks and inspiration produced by the Tableau Community.
Let’s talk about gratitude for a moment.
Avinash Reddy Munnangi recently wrote a blog post on 10 Reasons Why You Need a Tableau Public Profile, and it’s spot on! In the visual analytics space, there is truly nothing like Tableau Public. It is the place where we can learn and teach. The place where we can inspire and get inspired. The place where we can show our talents and drive our skills and careers to new heights! The most amazing part? It’s 100% free.
I’ve been a part of the Tableau Public community for five years now, and I’m so thankful for this community. It has allowed me to really hone my skills, and it’s led to job opportunities and lots and lots of inquiries about my availability (TL;DR I’m not).
It’s easy for us, perhaps, to take this treasure trove of content for granted—we’re so used to having a place to reference, reverse-engineer, and revel in on a daily basis. So I love when I see blog posts explaining the wonder that is the largest BI deployment in the world: Tableau Public.
Which brings me back to gratitude. To the original “parents” of Tableau Public, Ellie Fields and Ben Jones, and to the current guardians, Taha Ebrahimi and her entire team, let’s give a heartfelt thank you and round of applause!
With that, let’s dive into this month’s Best of the Tableau Web and see just what the #DataFam was up to in May! For updates throughout the month, follow me Twitter and LinkedIn, and check out the list of blogs that Andy Cotgreave and I follow for Best of the Tableau Web. If you don’t see yours on the list, we invite you to add it here.
Formatting, Design, Storytelling
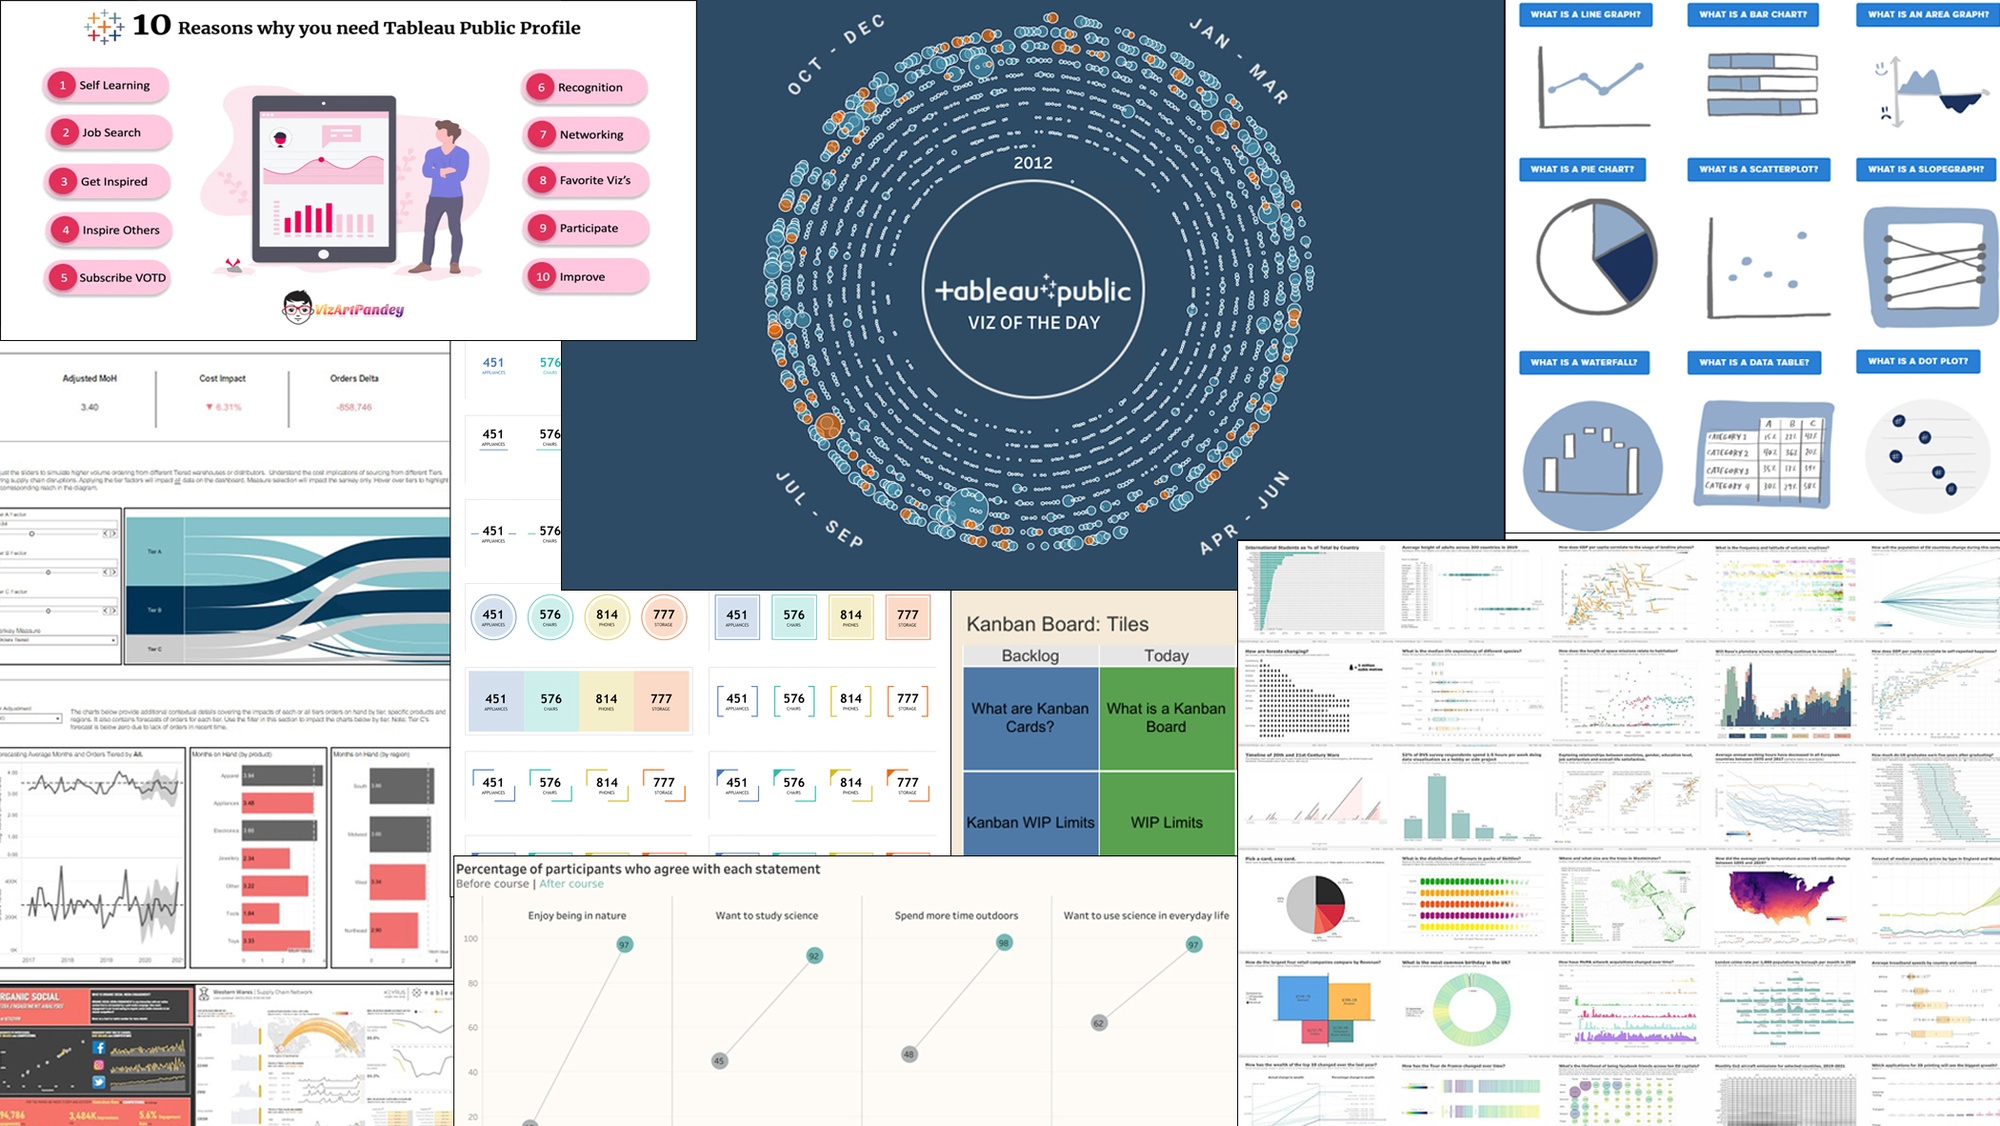
Alexander Mou, Vizible Difference: Creating Kanban Board in Tableau
Kevin Flerlage, The Flerlage Twins: 22 Different BAN Designs
Brandi Beals: Up Your Game with a Tableau Style Guide
Steve Wexler, Data Revelations: The Blessing and Curse of Being a Professional Chart Looker-atter
Mark Bradbourne, Sons of Hierarchies: The Check List AKA “Oh, I forgot to…”
Inspiration
Avinash Reddy Munnangi, Welcome to Vizartpandey: 10 Reasons why you need Tableau Public Profile
Adam Mico: Tableau-ing to the Fullest…
Marc Reid, Datavis.blog: Reflections on the #30DayChartChallenge
Neil Richards, Questions in Dataviz: How do you make better data visualisations?
Tips and Tricks
Donna Coles, Donna + DataViz: Can you performance tune this workbook?
Bridget Cogley, TableauFit: How the EXCEL do I shape that?! Data Grains for (Wholesome) Analysis
Marc Reid, Datavis.blog: Creating a dot-dash-plot in Tableau
Jim Dehner, See it your way: Zero to Zen and 5 Stops Along the Way
Code
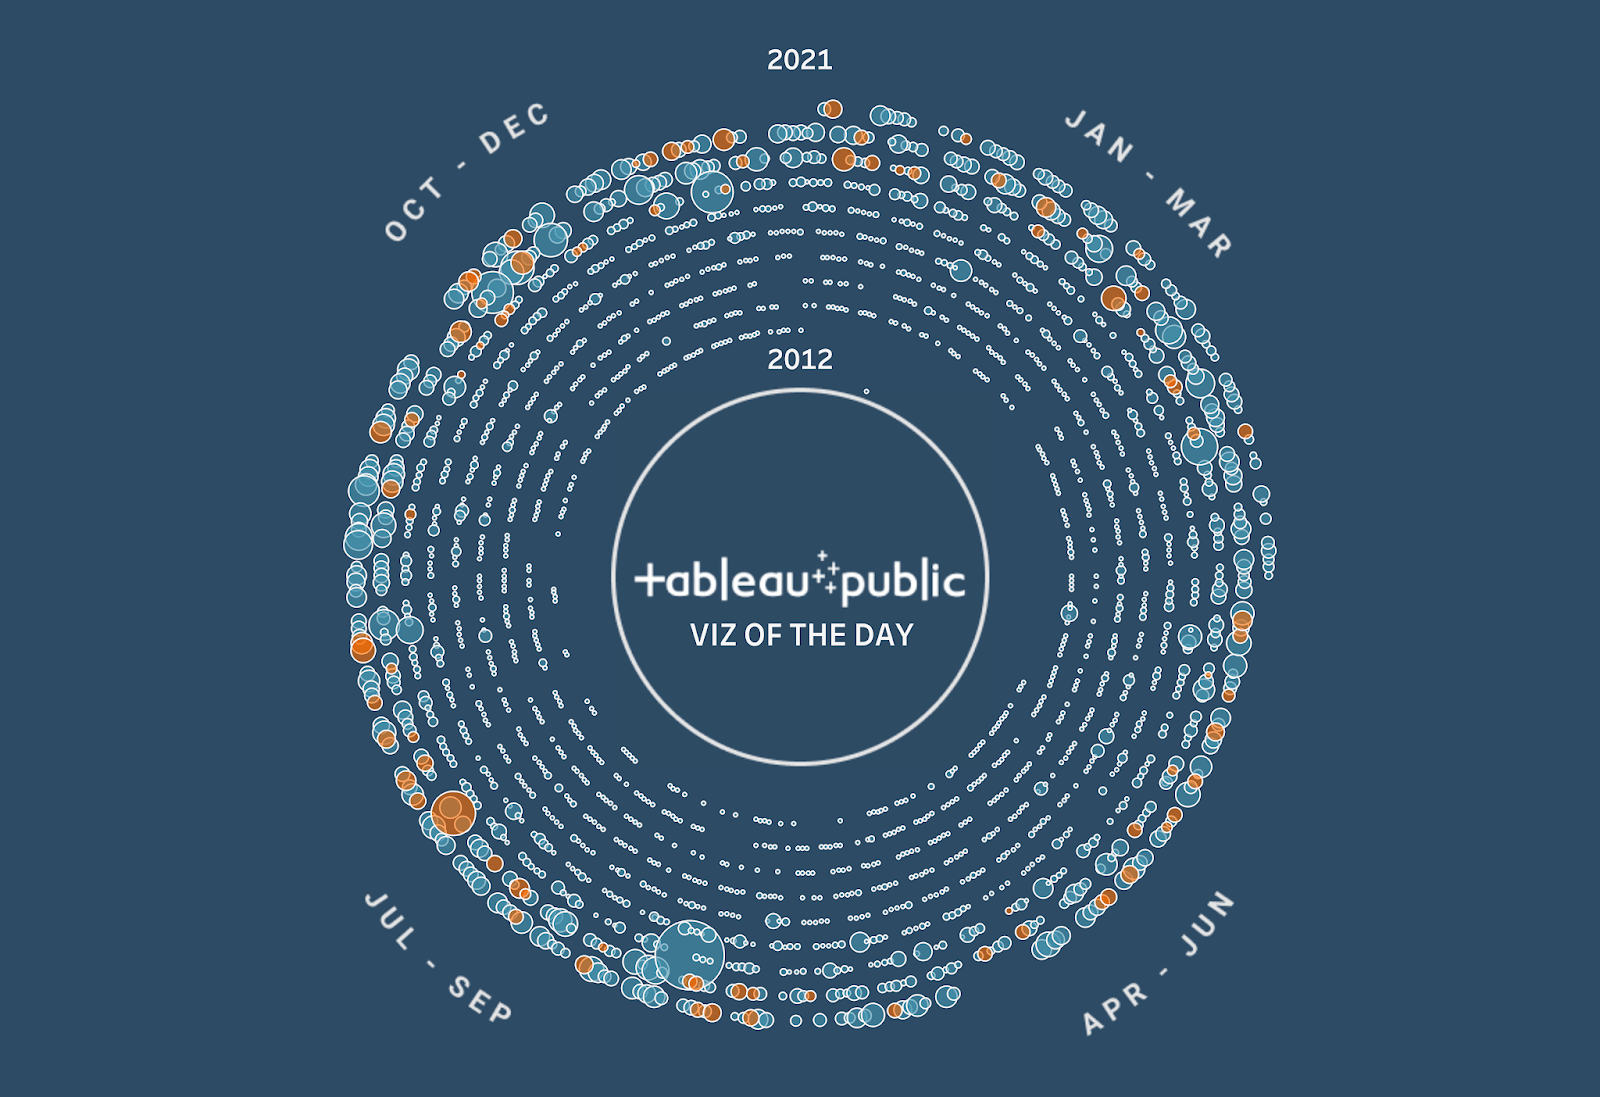
- Tableau Public APIs Plus a VOTD Data Set
Will Sutton, guest blog on The Flerlage Twins - An Introduction To Tableau Regular Expressions (REGEX)
Don Wise, guest blog on The Flerlage Twins - Responsive Design and Embedded Tableau Vizes—responsive_scaling_tableau.js
Tableau and Behold!
Tableau Prep
- Tableau Prep: A Great Way to Get Squeaky Clean Data
Tamara Allcock, The Data School
- How to... Use String Functions
Carl Allchin, Preppin' Data
Related Stories

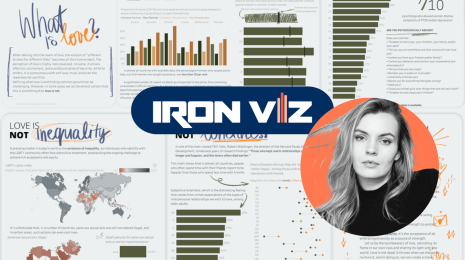
Meet Iron Viz 2024 Finalist Jessica Moon
 April 15, 2024
DataFam Roundup: April 8–12, 2024
 April 12, 2024
Meet Iron Viz 2024 Finalist Pata Gogová
April 8, 2024
Subscribe to our blog
Get the latest Tableau updates in your inbox.