DataFam Roundup: March 5, 2021


Happy Friday! Dig into the latest DataFam Roundup—a weekly blog post that brings together what’s trending in the community all in one post. As always, we invite you to send us your content—and the DataFam content from your peers that have inspired you! Find the content submission form here.
DataFam blog content

IWD: Kimly Scott And Amy Tran On Women In Power, Women Love Tech
Dive into content created by the Tableau Community:
- I Learned Tableau And So Can You Ghafar Shah
- An Interview with Annabelle Rincon (A Tableau Ambassador and Analytics TUG Co-Lead) Adam Mico
- Tableau OEM and Embedded Community Alex Eskinasy
- IWD: Kimly Scott And Amy Tran On Women In Power Women Love Tech
- Tableau Design Tips Zak Geis
Upcoming events
RDU Tableau User Group
Join an upcoming Tableau User Group event:
- March 17, 2021: #MadisonTUG Virtual
- March 18, 2021: Atlanta Tableau User Group
- March 11, 2021: RDU Tableau User Group
Check out all the virtual Tableau User Group events here.
Event Recording: Chart Chat Round 19 Watch as Jeffrey Shaffer, Steve Wexler, Amanda Makulec, and Andy Cotgreave, debate the good, the bad, and the “screaming cats” of data visualization.
Vizzes
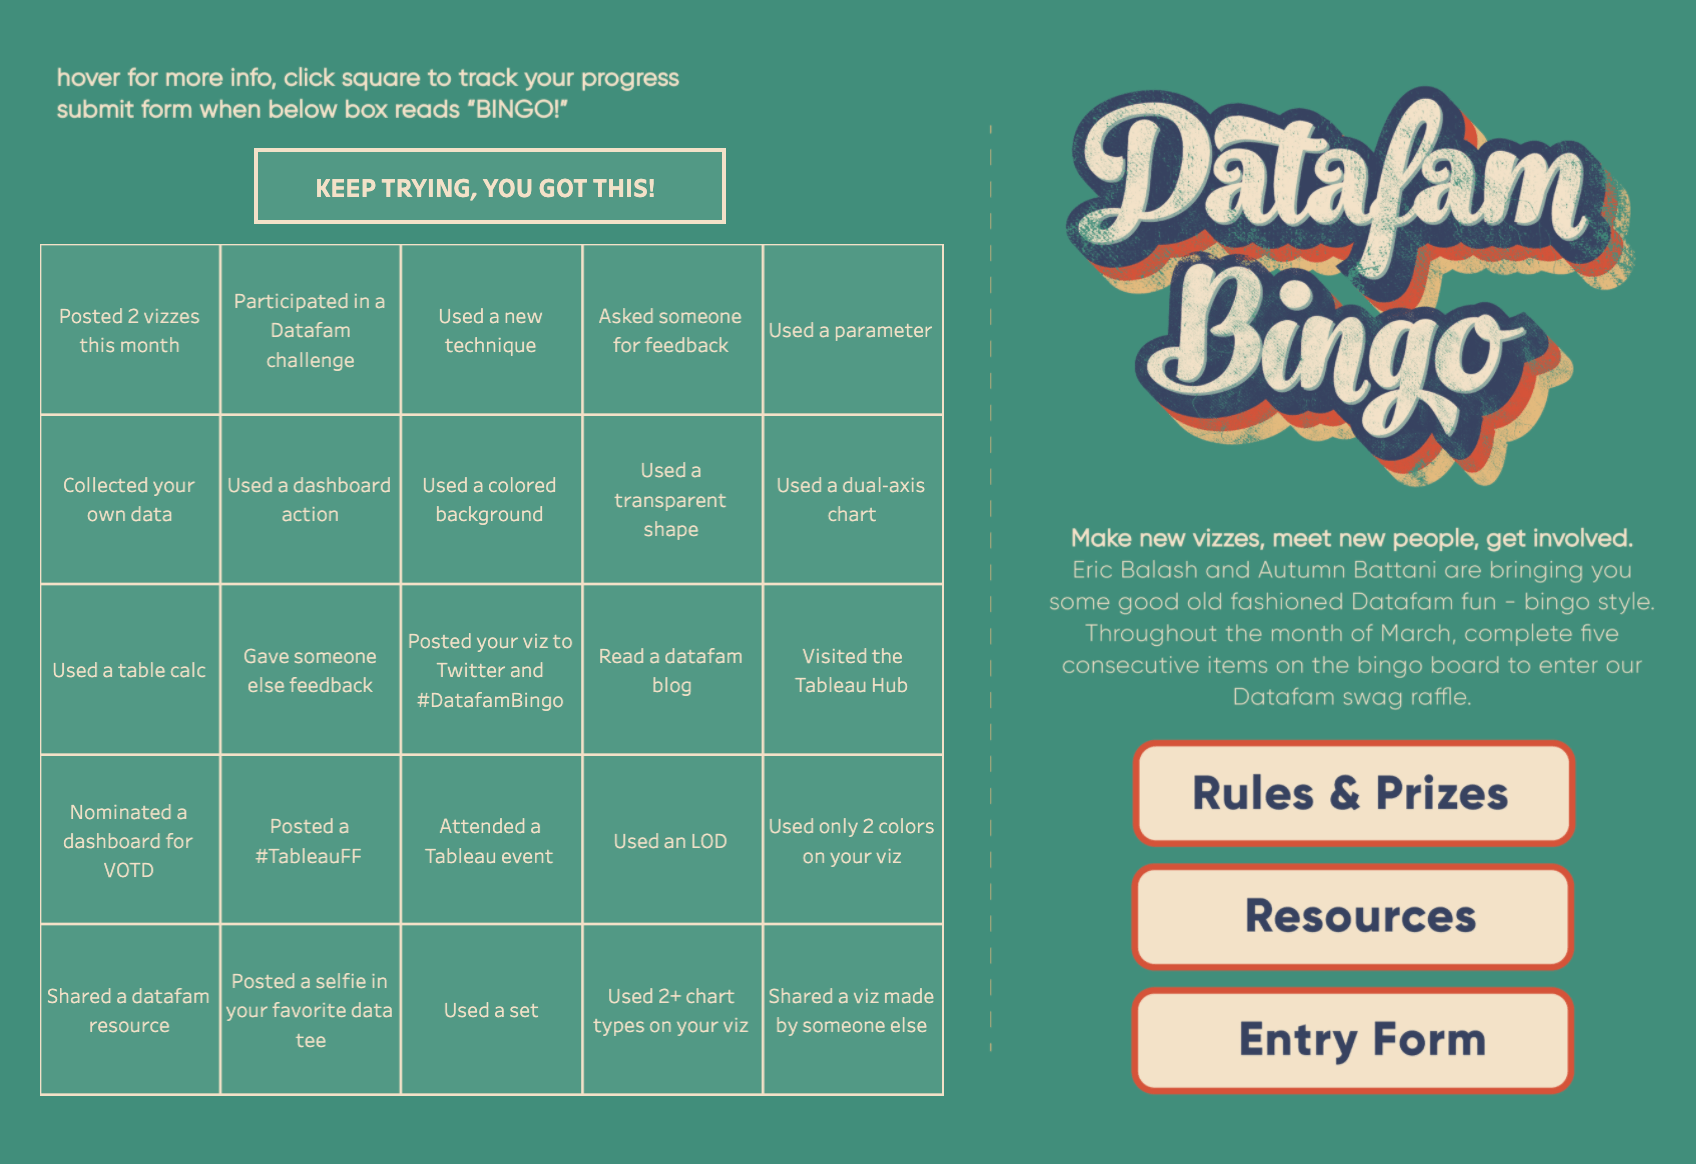
Datafam Bingo Autumn Battani
Catch this week’s Viz of the Days here and subscribe to get them emailed directly to your inbox.
Check out some inspirational vizzes created by the community:
- Datafam Bingo Autumn Battani
- Angela Davis Olushola Olojo
- The Texas Blackout Francisco Cardoso
- A timeline of the UN observances Wendy Shijia
- The Apostle PAUL Ryan Hart
Community Projects

Stay in the loop on the Tableau Community Projects:
Makeover Monday: Join the community every Monday to work with a given data set and create better, more effective visualizations. #MakeoverMonday
Workout Wednesday: Build your skills with a weekly challenge to re-create an interactive data visualization. #WOW2021
Sports Viz Sunday: Create and share data visualizations using rich, sports-themed data sets in a monthly challenge. #SportsVizSunday
- March 2021: Adaptive Sports
Iron Quest: Practice data sourcing, preparation, and visualization skills in a themed monthly challenge. #IronQuest #IronQuest
- February 2021: History
Storytelling with Data: Practice data visualization and storytelling skills by participating in monthly challenges and exercises. #SWDChallenge
- March 2021: March MAPness
Project Health Viz: Uncover new stories by visualizing healthcare data sets provided each month. #ProjectHealthViz
- March 2021: Adaptive Sports
SDG Viz Project: Visualize data about Sustainable Development Goals provided by the World Health Organization. #TheSDGVizProject
- February 2021: Goal 13 - Climate Action
Preppin’ Data: A weekly challenge to help you learn to prepare data and use Tableau Prep. #PreppinData
- 2021 Week 9: Working with Strings
Real World Fake Data: Create business dashboards using provided data sets for various industries and departments.#RWFD
- Dataset #7: Healthcare – ER
Viz 2 Educate: Each month, create vizzes on global education syllabus topics as resources for teachers worldwide. #Viz2educate
- February: History
Viz for Social Good: Volunteer to design data visualizations that help nonprofits harness the power of data for social change. #VizforSocialGood
- Feb 20, 2021-Mar 14, 2021: Vera Aqua Vera Vita
Diversity in Data: An initiative centered around diversity, equity & awareness by visualizing provided datasets each month. #DiversityinData
- March 2021: Adaptive Sports
Related Stories
DataFam Roundup: April 15–19, 2024
 April 19, 2024
DataFam Roundup: April 8–12, 2024
April 12, 2024
DataFam Roundup: April 1–5, 2024
April 5, 2024
Subscribe to our blog
Get the latest Tableau updates in your inbox.