DataFam Roundup: September 20 - 24, 2021


Dig into the latest DataFam Roundup—a weekly blog that brings together community content all in one post. As always, we invite you to send us your content—and the DataFam content from your peers that have inspired you! Find the content submission form here.
DataFam content
Maddie Dierkes: How to Isolate Linear Regression Equations in Tableau
Dive into content created by the Tableau Community:
- Donabel Santos: Tableau | 8 Dashboard Container Tricks
- Maddie Dierkes, Playfair Data: How to Isolate Linear Regression Equations in Tableau
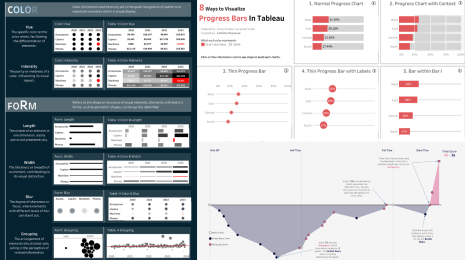
- Toan Hoang: Rounded Progress Bar Tutorial
- Kieran Adair, The Data School Australia: How To Embed Spotify Tracks Into Your Tableau Dashboards
- Andy Kriebel, VizWiz: How to Label the Inside and Outside of a Bar Chart
- Arun Y.: Tableau v/s Power BI Administration Capabilities
- Joti Gautam: Visualising Generation One Pokemon Cards
- Dawn Harrington, Tech Tips Girl: Advanced Tips You Didn't Know That You Should Know
- Steve Adams and Sharon Cropper: From "filled with dread" to helping colleagues with Tableau calculations...
- Sagar Kapoor and Kasia Gąsiewska-Holc, VizConnect: Embedding dashboards within another Tableau dashboard
- Jared Flores, WhatTheViz: How to use Self Joins in Tableau Prep
- Ken Flerlage, The Flerlage Twins: QGIS for Tableau Users # 3: Getting Together and Breaking Up (Combining and Splitting Polygons)
- Brad Fair: Tableau Server on Kubernetes
- Jonathan Drummey and Keith Helfrich, The Sensemaker's Video Podcast: Why did Tableau Invent Relationships?
- CJ Mayes: Don’t Burst My Bubble
- Maggy Muellner, Playfair Data: Tableau Hack: How to Dynamically Highlight Selections in Connected Scatter Plots
- Jeremy Anderson, DataDrive: Top Five Tips to Ace the Tableau Desktop Specialist Exam
- Tim Ngwena, Tableau Tim: Tableau Tutorial for Beginners: Tableau Server & Tableau Online Permissions: Part 1
Upcoming events and community participation

Tableau Conference Register Today!
- Tableau Conference: Join Tableau and the world's largest data community online for three days of learning, connection, and inspiration. Register Today!
- Iron Viz, the world’s largest virtual data visualization competition—ignites and showcases the power of the Tableau Community, giving you the opportunity to interact with data rockstars worldwide. Three finalists will advance to the 2021 Iron Viz Championship this November at Tableau Conferece.
- Virtual Data Careers Fair (UK and Europe) - October 6th at 9 a.m. BST: Curious about what a career in data looks like? Tableau Academic Programs is hosting its first ever virtual Data Careers Fair, providing students, graduates, and job seekers with direct access to recruiters from some of our top customers - representing a wide range of employers, all with openings in the data and analytics space.
- #Viz4Climate Action Viz Challenge - Participate by October 10th! #TheSDGVizProject is thrilled to team up with Tableau for the #Viz4ClimateChange challenge leading up to the #COP26 UN Climate Conference. Submit your climate related vizzes by October 10th for a chance to win one of three $100 gift cards to the Tableau Store, and to be featured on Tableau Public! Vizzes will be judged by Andy Cotgreave (Tableau) and Clayton Aldern, data journalist at Grist. Click the link for challenge guidelines.
- Data Book Club with Brandi Beals: This fall we'll be reading The Adaptation Advantage by Heather McGowan and Chris Shipley. While not specifically about data, the book will get us to think outside the box and challenge our approach to data. The first virtual discussion will be held on Tuesday, September 28 at 12pm CT.
- Are you a visualization and storytelling expert? Enter the Data Viz Competition to showcase your data-driven artistic skills while competing for top prizes!
- Data Visualization: State of the Industry 2021: The purpose of this survey is to help the Data Visualization Society and the broader data visualization community understand the state of data visualization, the people who make it, the challenges they face, what can help practitioners, and where the field is headed.
Vizzes
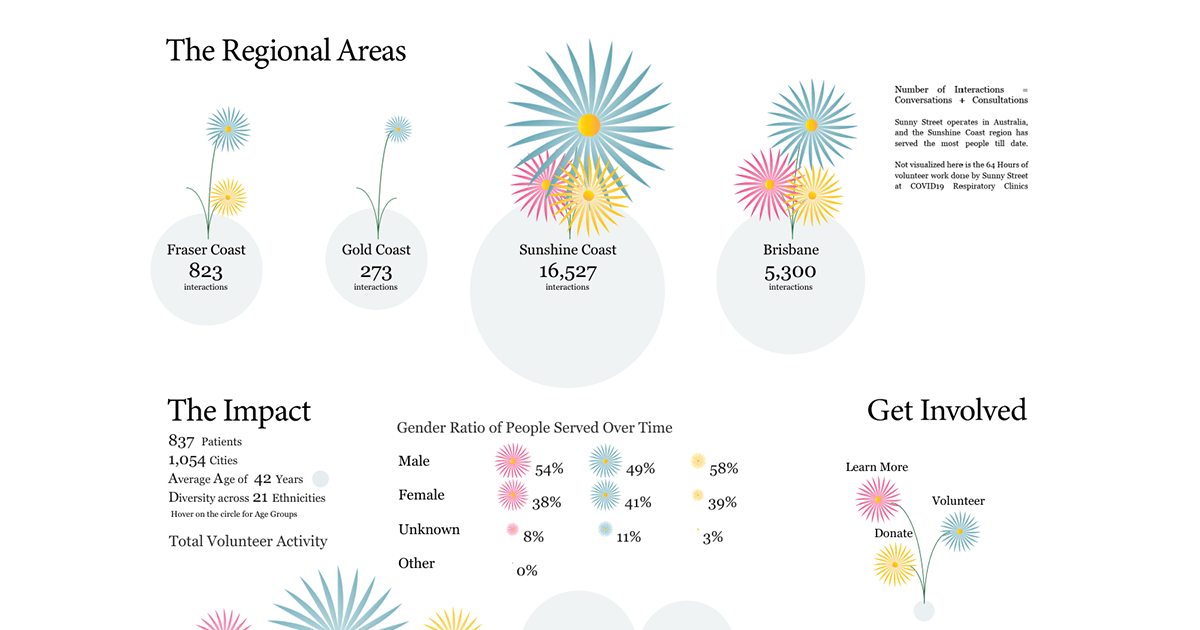
Chimdi Nwosu: Organization: Sunny Street #VizForSocialGood
Catch this week’s Viz of the Days here and subscribe to get them emailed directly to your inbox.
Check out some inspirational vizzes created by the community:
-
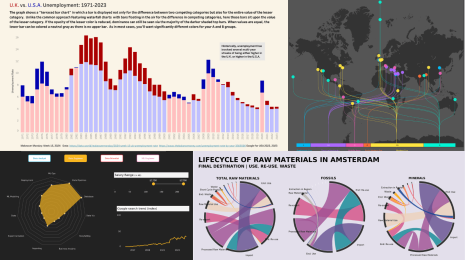
Saverio Rocchetti: Diversity At Oscars
-
Adam Green: US OPEN GS WOMENS FINAL 2021 (#IronQuest)
-
Chimdi Nwosu: Organization: Sunny Street #VizForSocialGood
-
Sam Epley: The Sunrises & Sunsets of Africa
Community Projects

Makeover Monday
Join the community every Monday to work with a given data set and create better, more effective visualizations.
Web: Makeover Monday
Twitter: #MakeoverMonday
Week 38: Dark Web Price Index 2021
Workout Wednesday
Build your skills with a weekly challenge to re-create an interactive data visualization.
Web: Workout Wednesday
Twitter: #WOW2021
Week 38: How Can You Quickly Tell the Net Change Between Two Dates?
Sports Viz Sunday
Create and share data visualizations using rich, sports-themed data sets in a monthly challenge.
Web: Sports Viz Sunday
Twitter: #SportsVizSunday
September 2021: Sporting Heroes & Legends
Iron Quest
Practice data sourcing, preparation, and visualization skills in a themed monthly challenge.
Web: Iron Quest
Twitter: #IronQuest
September 2021: Sporting Heroes & Legends
Storytelling with Data
Practice data visualization and storytelling skills by participating in monthly challenges and exercises.
Web: Storytelling with Data
Twitter: #SWDChallenge
September 2021: envision education
Project Health Viz
Uncover new stories by visualizing healthcare data sets provided each month.
Web: Project Health Viz
Twitter: #ProjectHealthViz
September 2021: Biggest Healthcare Data Breaches
SDG Viz Project
Visualize data about Sustainable Development Goals provided by the World Health Organization.
Web: SDG Viz Project
Twitter: #TheSDGVizProject
COP26 UN Climate Change Conference: #VIZ4CLIMATEACTION
Preppin' Data
A weekly challenge to help you learn to prepare data and use Tableau Prep.
Web: Preppin’ Data
Twitter: #PreppinData
Week 33: Excelling at adding one more row
Real World Fake Data
Create business dashboards using provided data sets for various industries and departments.
Web: Real World Fake Data
Twitter: #RWFD
Dataset #12: Hospitality
Viz 2 Educate
Each month, create vizzes on global education syllabus topics as resources for teachers worldwide.
Web: Viz 2 Educate
Twitter: #Viz2educate
Topic: Microbiology
Diversity in Data
An initiative centered around diversity, equity & awareness by visualizing provided datasets each month.
Web: Diversity in Data
Twitter: #DiversityinData
August 2021: Refugee Data
Viz for Social Good
Volunteer to design data visualizations that help nonprofits harness the power of data for social change.
Web: Viz for Social Good
Twitter: #VizforSocialGood
Zugehörige Storys
DataFam Roundup: April 8–12, 2024
 12 April, 2024
DataFam Roundup: April 1–5, 2024
5 April, 2024
DataFam Roundup: March 25–29, 2024
29 März, 2024
Blog abonnieren
Rufen Sie die neuesten Tableau-Updates in Ihrem Posteingang ab.