DataFam Roundup: March 29 - April 2, 2021


Welcome back! Dig into the latest DataFam Roundup—a weekly blog post that brings together what’s trending in the community all in one post. As always, we invite you to send us your content—and the DataFam content from your peers that have inspired you! Find the content submission form here.
DataFam blog content
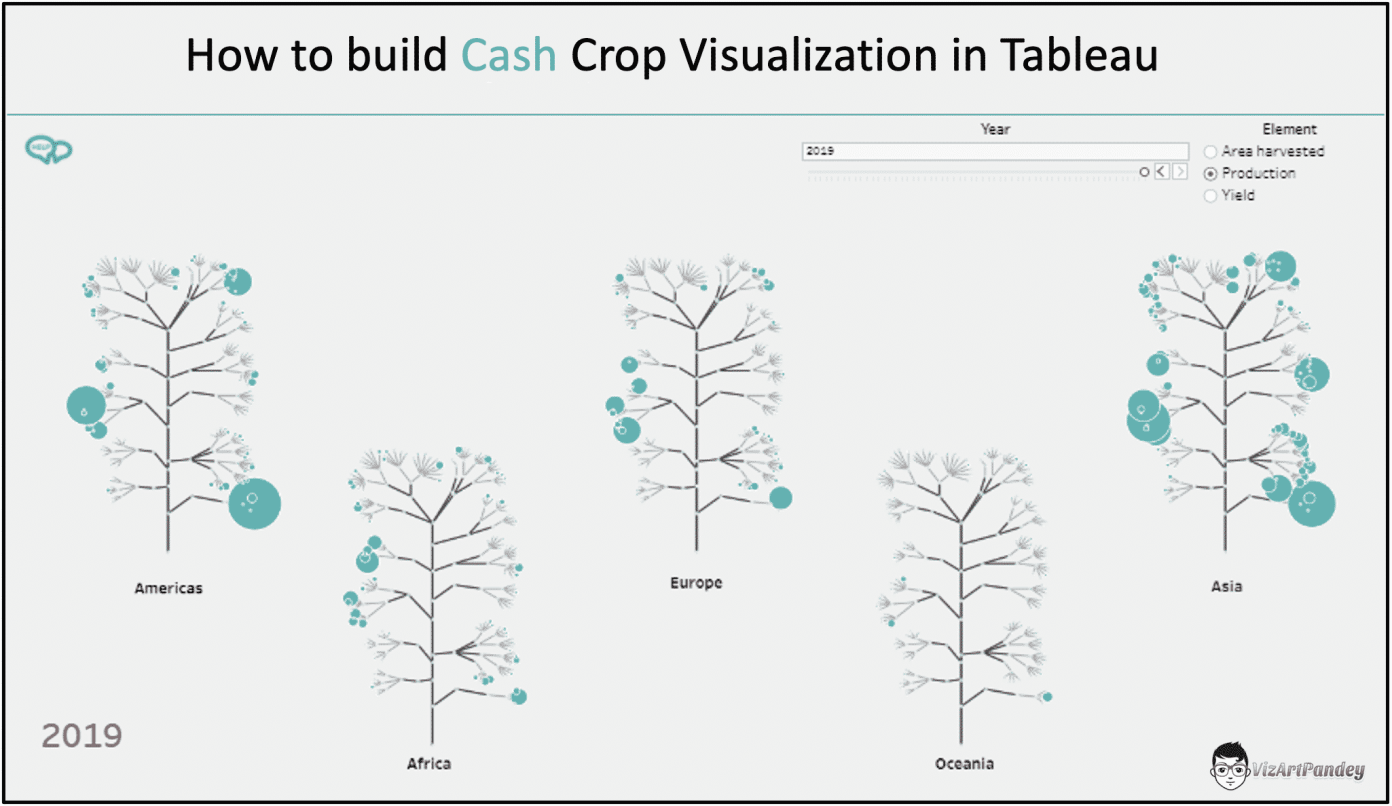
How to Build Cash Crop Visualisation in Tableau, Rajeev Pandey
Dive into content created by the Tableau Community:
- Diagonal Reference Lines in Tableau Tiny Viz Talks
- How to Build Cash Crop Visualisation in Tableau Rajeev Pandey
- Working with #Dataviz in 2021 — What’s Next? (And What Matters?) Ravi Mistry
- A Tableau guide to Salesforce Alex Waleczek
- 关于企业数据分析的客户答疑 (Customer Q&A on Enterprise Data Analysis) 喜乐君 (chinese)
- History Recap Vinodh Kumar and Eve Thomas
Community content focusing on 2021.1
- Quick LODs: New inTableau 2021.1 Tim Ngwena
- Zero downtime licensing : New in Tableau 2021.1 Tim Ngwena
- What’s New in Tableau 2021.1: Snowflake Geospatial Support with Map Layers Ivett Kovács
- Everything you need to know about the in-product Tableau Exchange Infotopics
- Einstein Discovery in Tableau – Try it for Yourself Bobby Brill
Upcoming events
DataDev Day
Join an upcoming Tableau User Group event:
- April 14, 2021: National K-12 TUG
- April 16, 2021: Data + Women Latam
- April 21, 2021: Wisconsin Virtual TUG
- April 22, 2021: Data + Women Ireland
- April 26 2021: Analytics Tableau User Group
Check out all the virtual Tableau User Group events here.
May 20, 2021 Tableau’s first DataDev Day: We’re excited to announce a new, one-day event dedicated to DataDevs and anyone interested in or using the Tableau developer platform to create integrations and customize Tableau for their organizations.
Summer, 2021 Data Book Club: If you're interested in reading a book about data and discussing it with others, sign up for the Data Book Club!
Vizzes
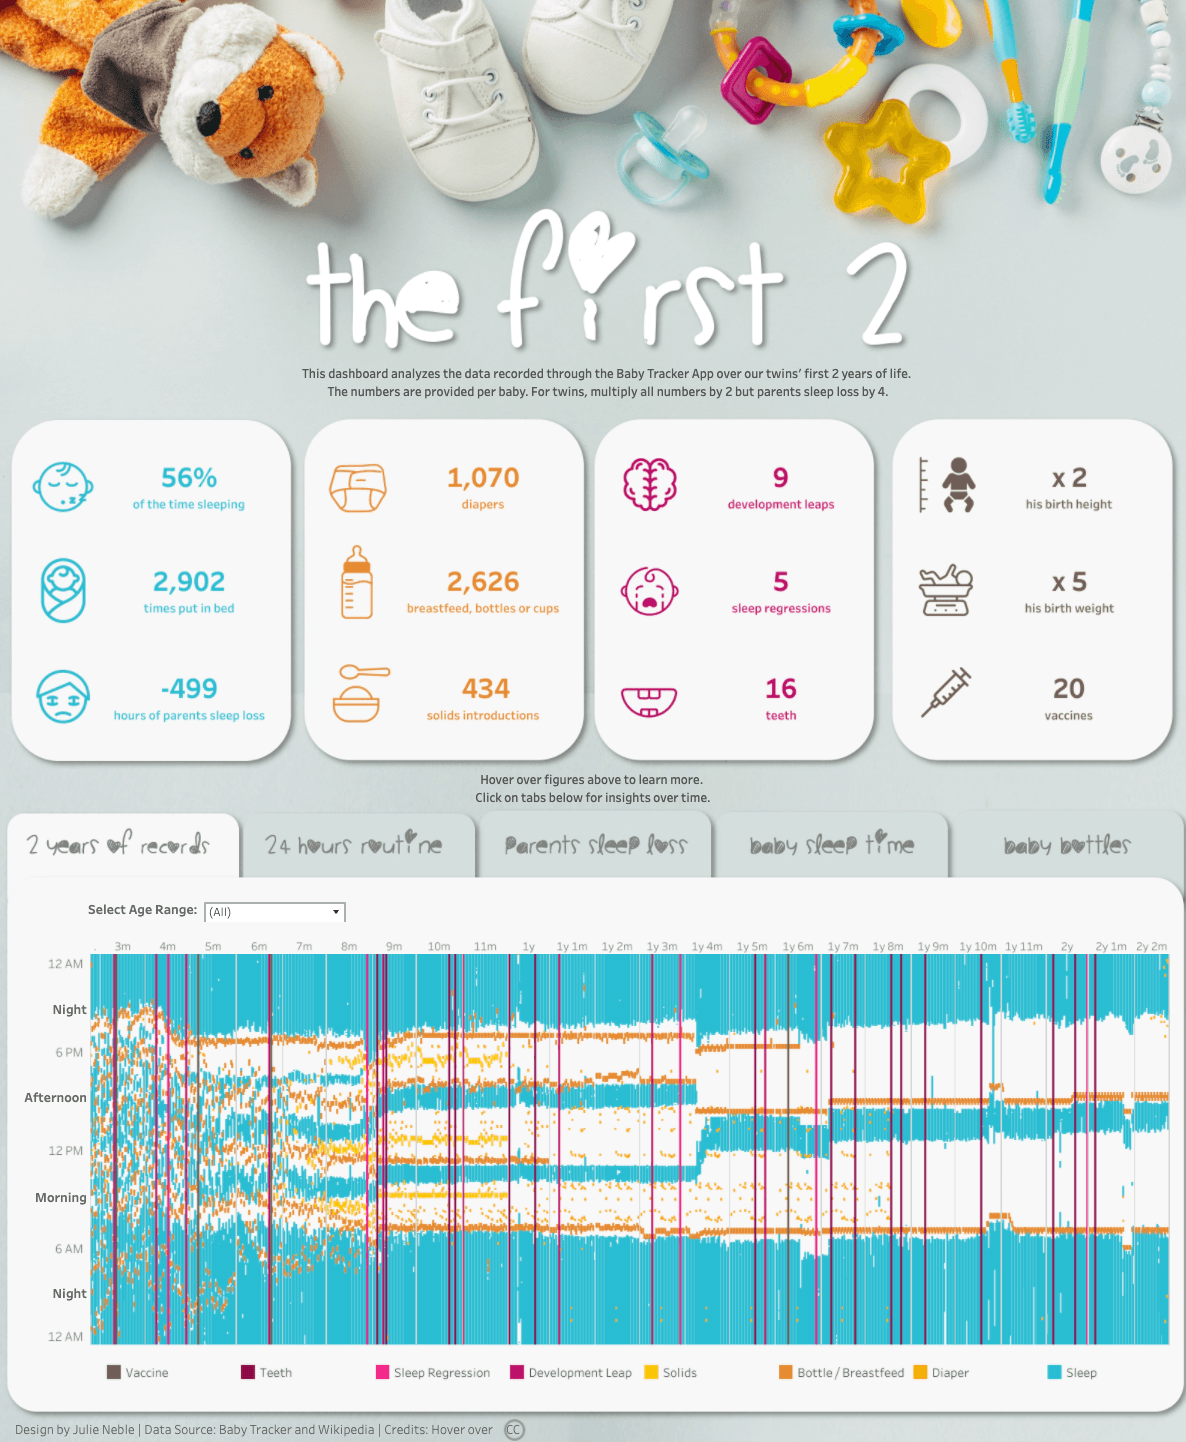
the first 2, Julie Neble
Catch this week’s Viz of the Days here and subscribe to get them emailed directly to your inbox.
Check out some inspirational vizzes created by the community:
- #MakeoverMonday | W13 | Brexports Christian Felix
- the first 2 Julie Neble
- Drillable Map demo Ellen Blackburn
Community Projects

Stay in the loop on the Tableau Community Projects:
Makeover Monday
Join the community every Monday to work with a given data set and create better, more effective visualizations.
Web: Makeover Monday
Twitter: #MakeoverMonday
Week 12: Exports to EU plunge by 40% in first month since Brexit
Workout Wednesday
Build your skills with a weekly challenge to re-create an interactive data visualization.
Web: Workout Wednesday
Twitter: #WOW2021
Week 13: What percentage of sub-orders are profitable?
Sports Viz Sunday
Create and share data visualizations using rich, sports-themed data sets in a monthly challenge.
Web: Sports Viz Sunday
Twitter: #SportsVizSunday
March 2021: Adaptive Sports
Iron Quest
Practice data sourcing, preparation, and visualization skills in a themed monthly challenge.
Web: Iron Quest
Twitter: #IronQuest
March 2021: Games
Storytelling with Data
Practice data visualization and storytelling skills by participating in monthly challenges and exercises.
Web: Storytelling with Data
Twitter: #SWDChallenge
March 2021: March MAPness
Project Health Viz
Uncover new stories by visualizing healthcare data sets provided each month.
Web: Project Health Viz:
Twitter: #ProjectHealthViz
March 2021: Adaptive Sports
SDG Viz Project
Visualize data about Sustainable Development Goals provided by the World Health Organization.
Web: SDG Viz Project
Twitter: #TheSDGVizProject
March 2021: Goal 14- Life Below Water
Preppin' Data
A weekly challenge to help you learn to prepare data and use Tableau Prep.
Web: Preppin’ Data
Twitter: #PreppinData
2021 Week 13: Premier League Statistics
Real World Fake Data
Create business dashboards using provided data sets for various industries and departments.
Web: Real World Fake Data
Twitter: #RWFD
Dataset #7: Supply Chain Manufacturing
Viz 2 Educate
Each month, create vizzes on global education syllabus topics as resources for teachers worldwide.
Web: Viz 2 Educate
Twitter: #Viz2educate
April: Arts & Music
Viz for Social Good
Volunteer to design data visualizations that help nonprofits harness the power of data for social change.
Web: Viz for Social Good
Twitter: #VizforSocialGood
Feb 20, 2021-Mar 14, 2021: Vera Aqua Vera Vita
Diversity in Data
An initiative centered around diversity, equity & awareness by visualizing provided datasets each month.
Web: Diversity in Data
Twitter: #DiversityinData
March 2021: Adaptive Sports
Related stories
DataFam Roundup: April 15–19, 2024
 19 April, 2024
DataFam Roundup: April 8–12, 2024
12 April, 2024
DataFam Roundup: April 1–5, 2024
5 April, 2024
Subscribe to our blog
Get the latest Tableau updates in your inbox.