Tableau Community

Tableau Public

Tableau Public is a free platform to explore, create and publicly share data visualisations. Get inspired by the endless possibilities with data.

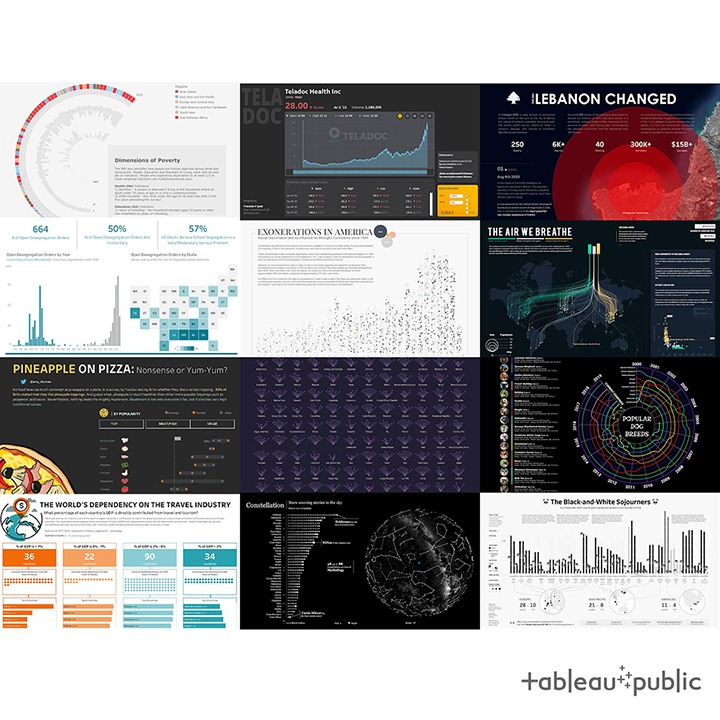
Find inspiration and improve your data skills with Tableau Public

Tableau Public isn’t only a free platform for visualising public data, it’s also where the Tableau Community can find limitless inspiration and learn from one another – but don’t just take our word for it. Hear from Tableau Zen Master and Tableau Ambassador Chantilly Jaggernauth on how Tableau Public has impacted her life both personally and professionally.

Watch now

Tableau your mind. Daily.

Sign up for Viz of the Day for your daily dose of creativity from the Tableau Community


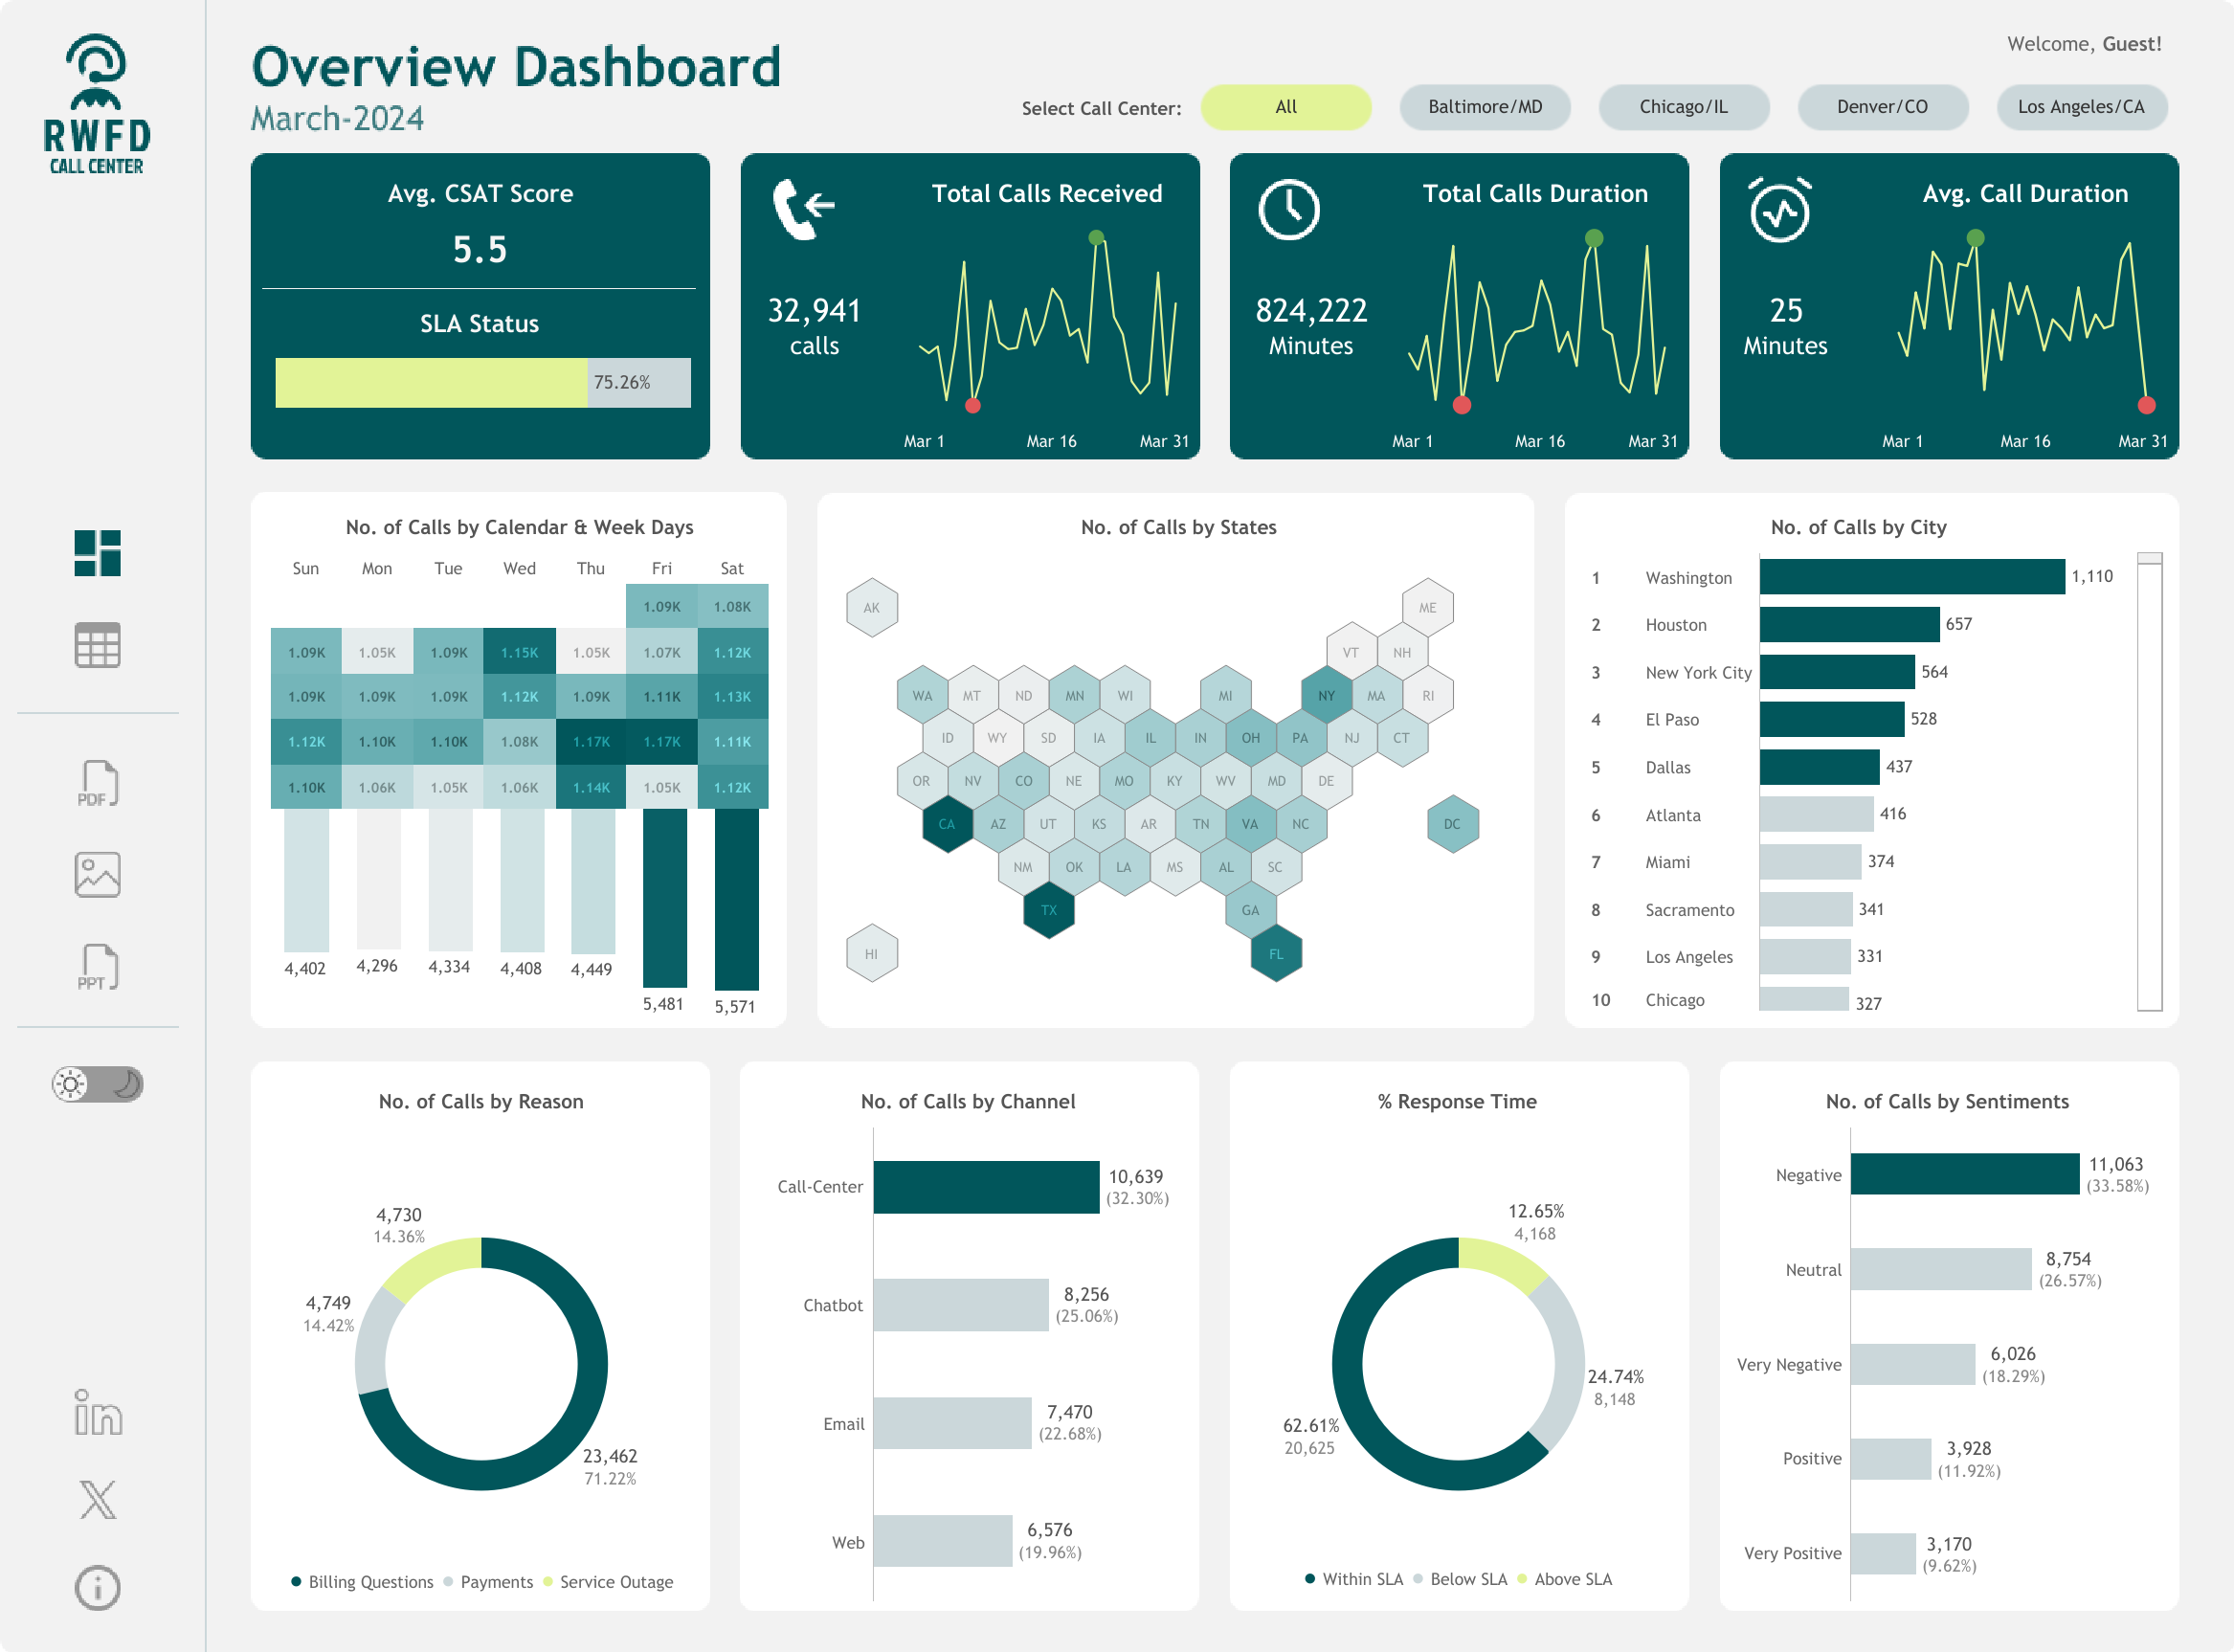
Call Center Dashboard

Get into call center insights with this #VizOfTheDay—a #RWFD entry by Waqar Ahmed Shaikh. Toggle between light and dark modes and analyze total calls, duration, response time, and more. Viz inspired by Gander Goldestan, and Ahmed Shyam.

Interact with the viz

View the latest and greatest from Tableau Public

Virtual viz gallery Opens in a new window

Explore a virtual art gallery of visualisations created by Tableau Public authors from around the world.

Behind the most favourited viz

Hear Andy Kriebel talk about his inspiration for creating the most favourited viz on Tableau Public.

Tableau Public Explorer

How well do you know the #DataFam? Explore this visualisation by Nir Smilga to learn about Tableau Public authors from around the world.

Check out these community members for inspiring visualistions

Following Tableau Public authors helps you discover new topics, visualisation ideas and community activities. Get started with our featured authors, a group of hand-picked data rockstars.

Damola (Adedamola) Ladipo

View profile

Damola (Adedamola) Ladipo
As a data visualisation specialist for the US Agency for International Development Data Services at DevTech Systems, Inc., Adedamola (Damola) uses Tableau. He started using Tableau Public last December to engage with the #DataFam community. So far, he has shared data visualisations for #MakeoverMonday, #DiversityinData and personal projects on various topics – from food apartheid to must-read books by black authors, and how mixed the martial arts is in the UFC. His broader interests include climate change, social issues, economics, sports and conflict. His favourite part about Tableau Public is learning from others and sharing work on informative topics. Connect with Damola through LinkedIn and Twitter.

Adeyomisola Adegeye

View profile

Adeyomisola Adegeye
Adeyomisola (Yomisola) discovered Tableau a year ago while building up her data analytics skills. She’s totally in love, since it made her analytics journey beautiful and became a game-changer for communicating with data. She actively participates in community-led projects like #DiversityinEntertainment and #MakeoverMonday, which have tremendously impacted her growth. She randomly surfs through the Tableau Public gallery for inspiration and reminds herself that there are great minds out there – she is one of them, too. Yomisola is so grateful for the #DataFam community; they’re not just inspirational, but loving and supportive. She enjoys travelling, reading, and listening to music and podcasts. Yomisola worked as a financial analyst for about three years and recently moved to Sweden where she is searching for new job opportunities. Connect with her via Medium, Twitter and LinkedIn.

James Strachan

View profile

James Strachan
James is a Tableau Desktop Certified Professional who works at Barclays in London and builds dashboards to help analyse and understand customer behaviour. Passionate about data viz, he started participating in #MakeoverMonday in 2020 to enhance his portfolio and further develop his data skills. What he likes about Tableau Public is the inspiration he gains from the vast array of dashboards, the friendly support of the #DataFam community on Twitter, and the awe-inspiring work of Tableau Zen Masters (where do they find the time to give so generously back to the community?) Although not the most prolific publisher, he enjoys creating experimental, artistic data vizzes on topics completely unrelated to his job, including reliving his youth with data sets about video games and retro toys. Connect with James on his blog, Twitter and LinkedIn.

Kasia Gasiewska-Holc

View profile

Kasia Gasiewska-Holc
Kasia is a senior marketing analyst at the London Stock Exchange Group (LSEG) and was introduced to Tableau three years ago. Ever since, she’s been hooked and captivated by the power of data visualisation. She uses Tableau Public to connect with other like-minded people and translate creative thoughts into data stories. As a member of the #DataFam community, she loves to follow other data viz geeks, learn from them and use their work as inspiration for projects. She is particularly interested in sustainability and environmental topics, but also enjoys vizzing about lighter subjects (e.g. music or TV series). With each project, Kasia tries to push the limits of what can be done with Tableau and she’s keen on implementing unique custom animations in her vizzes. Connect with Kasia on Twitter and LinkedIn.

Kevin Wee 黃克文

View profile

Kevin Wee 黃克文
Kevin is a PhD candidate at Purdue University, researching the impact of animation design on students' learning experiences. Tableau Public enables him to showcase his capability in visualising data appropriately and creatively. It also allows him to share charts that he created for research with other collaborators, stakeholders and researchers, for example. Kevin’s favorite parts of Tableau Public are the user-friendly interface – on both the app and online – and the immense amount of resources available. He started using Tableau Public last October, has participated in #MakeoverMonday, and was chosen as a Favourite of the Week ten different times. His favourite topics to viz include higher education and student learning. Connect with Kevin on Twitter and his website.

Li Nguyen

View profile

Li Nguyen
Li is a data science consultant at McKinsey & Company. She first discovered Tableau during an internship and started using it with projects in 2020. She became passionate about data visualisation after she discovered #MakeoverMonday and #RWFD (real world fake data), and has actively participated since last December. She loves learning new tips and tricks from the community, but her favourite thing is scrolling through amazing vizzes on Twitter. Through the Tableau community, she has also discovered her passion for design. Combining Figma and Tableau has been a game-changer and her learning curve keeps growing. Connect with Li on LinkedIn and Twitter.

Márton Balla

View profile

Márton Balla
Márton is an economics student at Budapest Business School. He discovered Tableau last March when the pandemic hit and was blown away by the power of data visualisation. It allowed him to express himself creatively and communicate difficult ideas quickly and clearly. He loves to browse Tableau Public and follow the work of other #DataFam authors to learn and be inspired. His favourite topics include sports and music, but he also steps out of his comfort zone by participating in community initiatives like #MakeoverMonday and #IronQuest. Márton documents his journey and shares learnings on his blog. Connect with Márton on Twitter and LinkedIn.

Olushola Olojo

View profile

Olushola Olojo
Shola is an insights manager at Samsung Electronics UK. Beginning his Tableau Public journey in October 2020, he valued the embracive culture of the #DataFam community, and the tremendous support system Tableau offers to new users. By coupling a unique storytelling element in his Medium blogs and visualisations, Shola explores how data can help drive social change in Africa. He asserts that the #Viz5 initiative highly resonates with him as it calls to the forefront key social issues impacting the continent. Before working with data, he was an athlete and competed at the UK Championships and Olympic Trials. Connect with Shola on Twitter and LinkedIn.

Pahola Diaz

View profile

Pahola Diaz
Pahola creates daily visualisations for the community and for her work at ITPerforma. She enjoys all the functionalities of Tableau to deliver the best work she can. She is passionate about sharing information and hopes to add other #DataFam members to the Tableau Latinx community. She is the leader of TUG ComuniDatos and blogs at dataxa.com.co. Connect with Pahola on Twitter and LinkedIn.

Priyanka Dobhal

View profile

Priyanka Dobhal
Priyanka is a technical lead at USEReady. She was introduced to Tableau in 2018 and instantly fell in love with the art of visualisation. Tableau Public is like a blank canvas for her to paint, and her favourite part is the ability to share and learn from the #DataFam community. She believes in “Vizing what you love” and is mostly seen creating visualisations on films, music and sports. She enjoys creating the data sets for her visualisations and actively participates in community initiatives such as #MakeoverMonday, #WorkoutWednesday and #IronQuest. Priyanka credits her learning and growth to the community. Connect with her on Twitter and LinkedIn.

Toshiya Kijima

View profile

Toshiya Kijima
Toshiya is a data scientist who develops FX business at a Japanese bank. He discovered Tableau last March and was fascinated by analysing data and creating artistic visualisations. He discovered #MakeoverMonday last July and has regularly used Tableau Public since then. He likes to collect and process open data with Python to visualise it, and finds that it’s fun to uncover insights from complex, chaotic data. Tableau Public enables him to access the Tableau Community and see people with various backgrounds as he learns new ideas and techniques. Connect with Toshiya on LinkedIn and Twitter.

Whitney Wood

View profile

Whitney Wood
Whitney is a senior business intelligence manager at Charles Schwab who began using Tableau Public in early 2019. She quickly fell in love with how fun and rewarding it is to create visualisations on personal interests. She has a passion for creating artistic and uncommon charts in Tableau Public that focus on many topics spanning from animals to weather. She enjoys the daily inspiration that comes from community members’ visualisations and is an active member of the #DataFam, participating in #MakeoverMonday, #IronQuest and #RealWorldFakeData. Connect with Whitney on Twitter or LinkedIn.

Featured Tableau Public vzzes

Data visualization on Tableau Public

What is a good SAT score? by Mehras

A collaboration between community-led projects Back 2 Viz Basics (#B2VB) and #EduVizzers. This data viz visualizes the New York City SAT College Board results data using a scatter plot chart.

Sample Soft Drink Sales by Andy Kriebel 

Get an overview of product sales with this data viz on Tableau Public. Viz inspired by Priya Padham's Superstore Dashboard viz. 

Fertility Rates Across the World 2023 by Michael Fisayo Fajemilehin

Michael visualizes the fertility rates across the globe in 2023. Discover what country has the highest rate. 

I’m so inspired by the dashboards I find on Tableau Public. It really helps me see what’s possible and apply new techniques in my own work.

Get involved to make the most of Tableau Public

Practice with a community-led project

Improve your skills while making new connections with projects designed by the community, for the community – and powered by Tableau Public.

Learn more

Get help with Tableau Public

Ask questions and get advice on all your Tableau Public or data viz challenges directly from community experts.

Visit the forums Opens in a new window.

Share your Tableau Public feedback

We can’t think of anyone better to help us shape the future of Tableau Public. Create and vote on product ideas to let the Tableau development team know what matters to you.

Explore ideas Opens in a new window.

Join a user group near you

Whether you’re looking to show your visualisations to the community or want to see what others are up to, Tableau User Groups are a great way to get started.

Join a Tableau User Group Opens in a new window.