It’s easier than ever to perform surveys—and just as easy to get buried in survey data. Use Tableau to hear the voice of the customer coming through loud and clear. Tableau uses visual analysis as an interface to the data, which means anyone can investigate survey responses in-depth with key statistical measures built in. Zoom in and out of geographic regions and overlay census data with one button to find what’s unique about your audience. Then, share the experience with colleagues in one single comprehensive and interactive report that tells the story from every angle and at every level of drill-down. See how Tableau users conduct advanced survey analysis below.
Solutions
Survey Analysis
Pivot your data without the headache
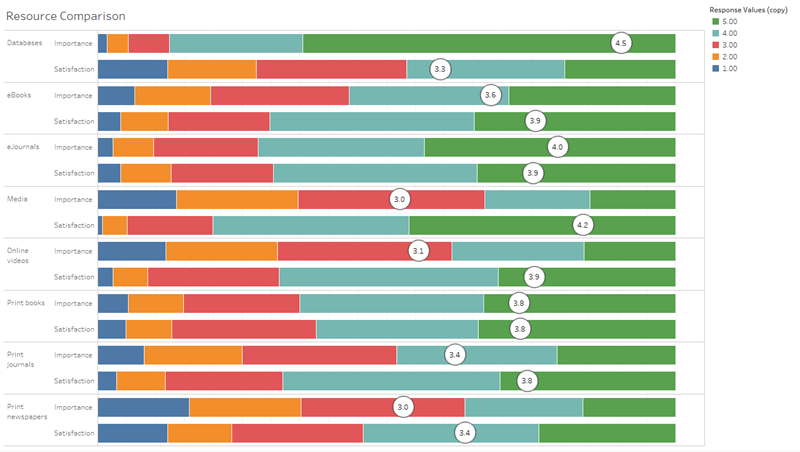
Survey data often places each question in its own column in a table. However, to be able to visualize and compare each question, they should all be together in one column. With Tableau, you can quickly pivot your data so that you can start analyzing the results without having to spend a lot of time restructuring it manually.
Connect with others using survey dataThe dashboards that we're using with the survey data allows users to explore and filter survey items based on various demographic profiles. The dashboard format is a very efficient and effective way to communicate survey data—to share insights at the presentations, at the meetings. It’s very quick, and it's very easy to produce, too.
Survey Analysis Resources
icon--whitepaper">
White paper
Visualizing Survey Data


Customer story
Audience Audit completes more work in half the time
More resources


Customer story
