
What is Tableau?
Tableau is a visual analytics platform transforming the way we use data to solve problems—empowering people and organizations to make the most of their data.
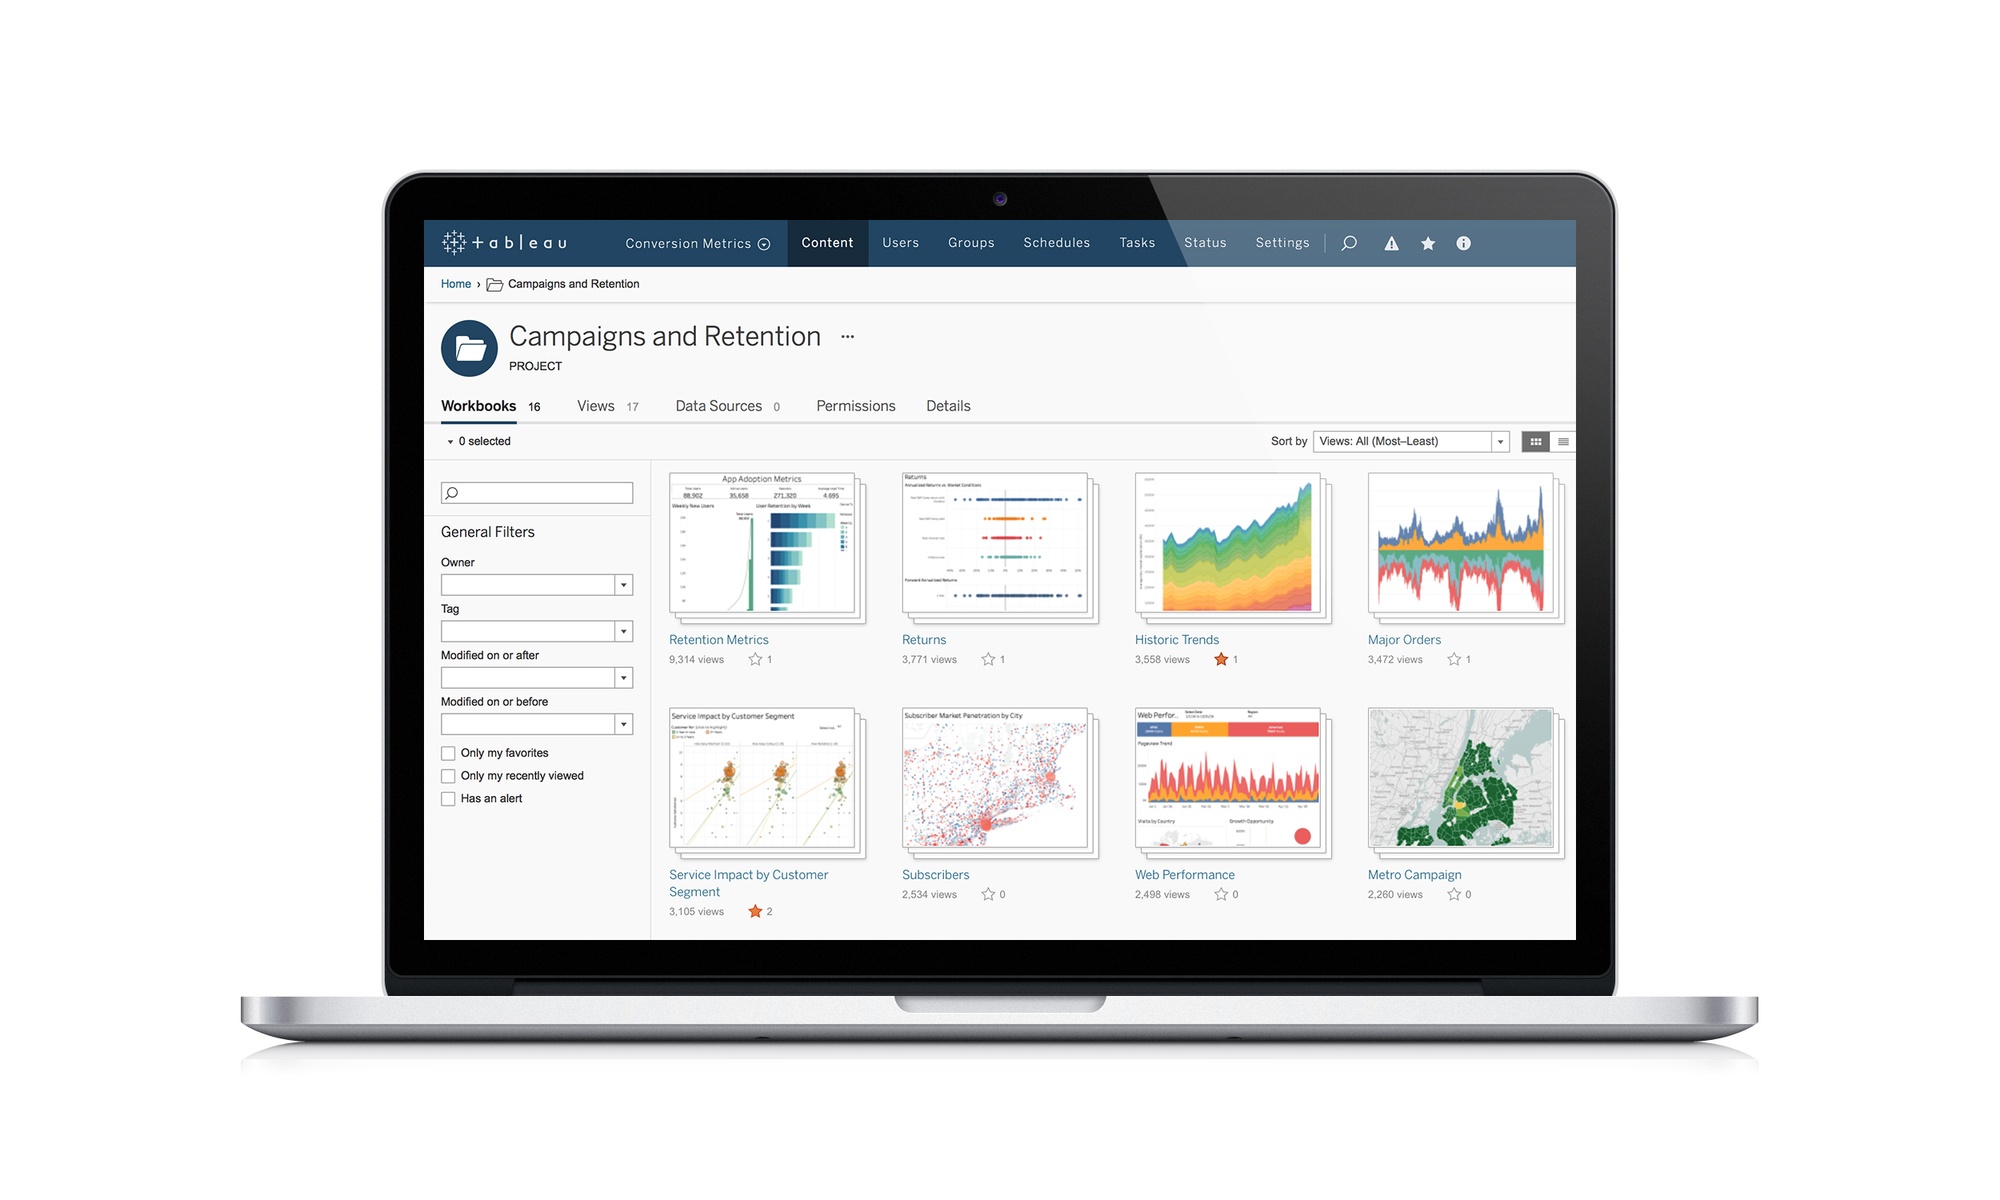
Meet the world's leading analytics platform.
Tableau helps people transform data into actionable insights. Explore with limitless visual analytics. Build dashboards and perform ad hoc analyses in just a few clicks. Share your work with anyone and make an impact on your business. From global enterprises to early-stage startups and small businesses, people everywhere use Tableau to see and understand their data.
Why Visual Analytics?
When you are trying to make sense out of your data, where do you begin? Two popular approaches to visual data analysis include data visualization and visual analytics. Each plays an important role in data exploration. You don’t have to choose one or the other—they both help you to see and understand your data.
5 Things Your Spreadsheets Can’t Do
For many, Excel is the go-to analysis tool of choice. As useful as it can be, for delivering real insight from big data, spreadsheets simply won’t provide all of the answers you seek.
Read this whitepaper to learn five critical ways to go beyond spreadsheets to get more from your data.
Customer Story: Grab
Grab is Southeast Asia’s leading mobile technology company, solving real-world transportation challenges for millions of people.
Discover how Grab used Tableau to track real-time metrics in different locations, leading to more strategic product launches—and ultimately a “super local” app experience.
Customer Story: AIA Singapore
AIA is a leading provider of insurance and financial services in Singapore. With Tableau, AIA Singapore was able to accelerate decision-making with timely insights and achieve seamless integration across many markets.
Learn how AIA Singapore used Tableau to optimize operations and understand the customer journey.
Have a question? Contact us here.