Parameters Are Like Knobs on an Old TV. Use Them to Change Input


In Tableau, parameters work like knobs on an old-school TV. Like those channel-changing knobs, parameters offer inputs the user can control.
Let’s say I coordinate internal training at a large company. My role is to make sure we’re offering the right courses to our employees and the courses are successful. I need to present three course-assessment metrics to my manager: how many hours are attended for each course, how each course rates on average, and how many students have taken each course.
I’m never sure which metric will be the most useful for a given conversation, so I want to build a visualization that contains all three pieces of information. I could make three views and build a dashboard, or have all three metrics on a single view. But I want to be able to narrow the scope a bit. This is a great time to use a parameter to control which metric is being used in the view.
The overall process is easy:
- Create a parameter to let us select which metric we want to use.
- Create a calculated field to tie that parameter to the data source.
- Use the calculated field in the view.
- Show the parameter control.
Essentially, the parameter is the knob the user can use to change the channel. The calculated field acts as the wires connecting the knob to the display.
Image by Wikimedia Commons user Fletcher6.
Creating the Parameter
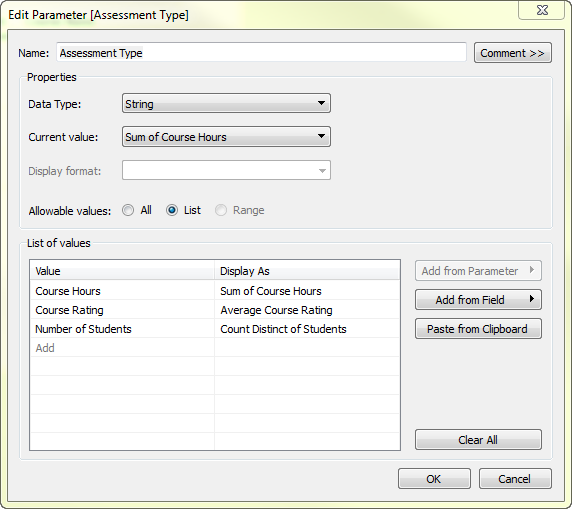
First, I have to create the parameter. All it takes is right-clicking in the data pane and selecting “create parameter." It’s good to name the parameter descriptively, especially if the workbook will end up with multiple parameters.
For data type, “string” makes the parameter use text values. For allowable values, “list” lets me type in the values I want.
Pay attention to the “value” field as we have to use exactly that string (case sensitive and all) in the calculated field. We can make “display as” whatever we want—this is what the end user will see, so I like to be descriptive.
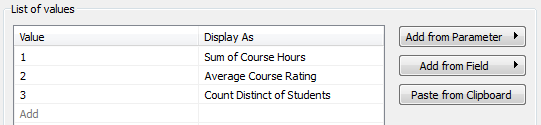
NB: Using a number in the value field can help boost performance because it’s easier for Tableau to compare a number than a whole text string.
Creating the Calculated Field
Now we have that parameter, but it doesn’t do us any good because it’s not yet impacting anything; it’s just a free-floating knob. We need to create a calculated field using the parameter’s input.
Simply right-click in the data pane and select “create calculated field.” I like to name the calculation something close to the parameter’s name so I know which calculated fields and parameters work together. I’ll name this “assessment.”
Because we need to go through several options for the parameter’s input and assign each to a specific field, I’ll use a CASE function. An IF function is another option, if preferred.
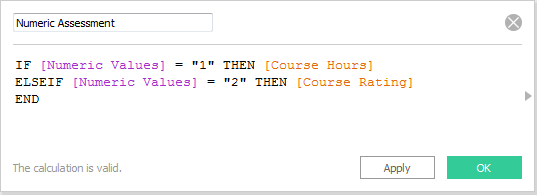
The CASE statement I need looks like this:
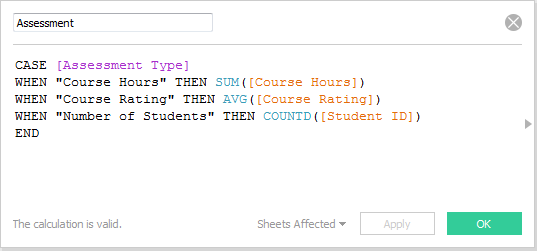
Essentially, what this does is tell Tableau: “When the parameter value says 'course hours,' give me the sum of course hours. When the parameter says 'course rating,' give me the average course rating. And when the parameter says 'number of students,' give me the count distinct of student ID.”
NB: The aggregation (sum, average, count distinct) doesn’t need to be specified in the calculation. If it isn’t, the aggregation can be set on the field in the view just like always. But if the different fields require different aggregations, like in this example, it’s a great trick to specify the aggregation in the calculation. Here’s a simplified calculated field using IF and numeric values in the parameter with no aggregation:
Building the View
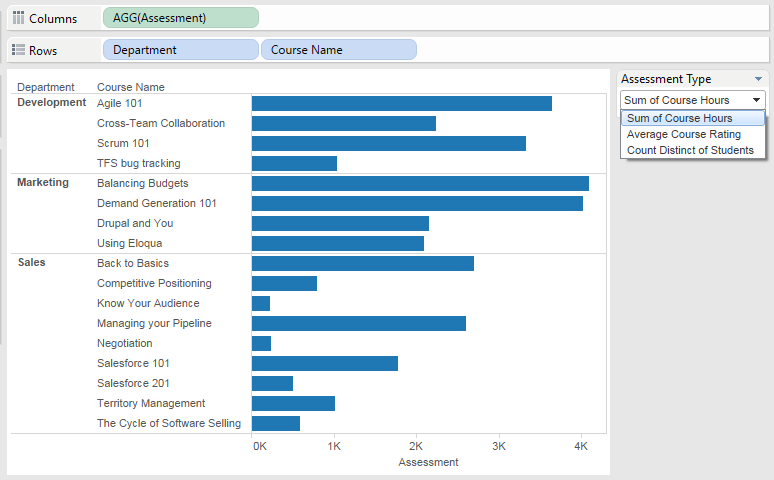
Now we have a field we can use in the view that responds to the parameter; we have a knob with wires coming out of it. But that knob isn’t able to control anything yet. We need to connect the other ends of the wires into the view. To do that, simply use the calculated field in the view. One important step is to make sure the knob accessible. Right-click on the parameter and select “show parameter control” to expose it in the view. The viewer can now change the parameter and the view will update.
Now we have a view that looks like this:
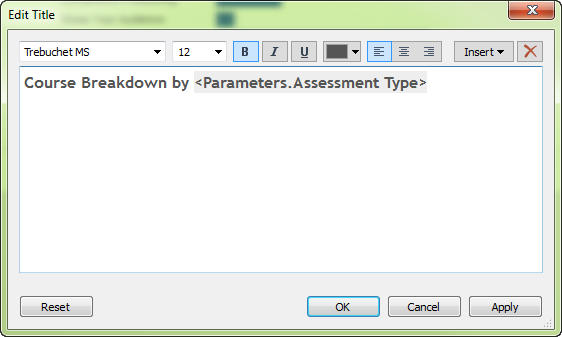
A final piece of polish I like to put on the view is to show the title and add the parameter, so it’s always clear exactly what is being shown.
The Finished Product
Now I have a dynamic, interactive view that lets me look at the courses we offer by the sum of course hours attended, the average rating for the course, or the number of individual students who’ve taken it—all with just a click of the mouse.

NB: if you learn best by watching it in action, check out the on-demand video on using a parameter to change fields in the view.
Suscribirse a nuestro blog
Obtenga las últimas actualizaciones de Tableau en su bandeja de entrada.