Data is interdisciplinary: Not a new concept but an essential practice


Tableau for Teaching is on a mission to create a data-literate world. At Tableau, we feel that data literacy is essential for everyday life. We consume data across all disciplines and subject areas. What used to be thought of as a specialized field, it has become apparent that more than ever Data Literacy is a necessity for everyone.
In our new series, Data is Interdisciplinary, we’re excited to spotlight people in the education community that are striving towards using data across disciplines like:
- Social Sciences
- Humanities
- Business
- Natural and applied sciences
- and more
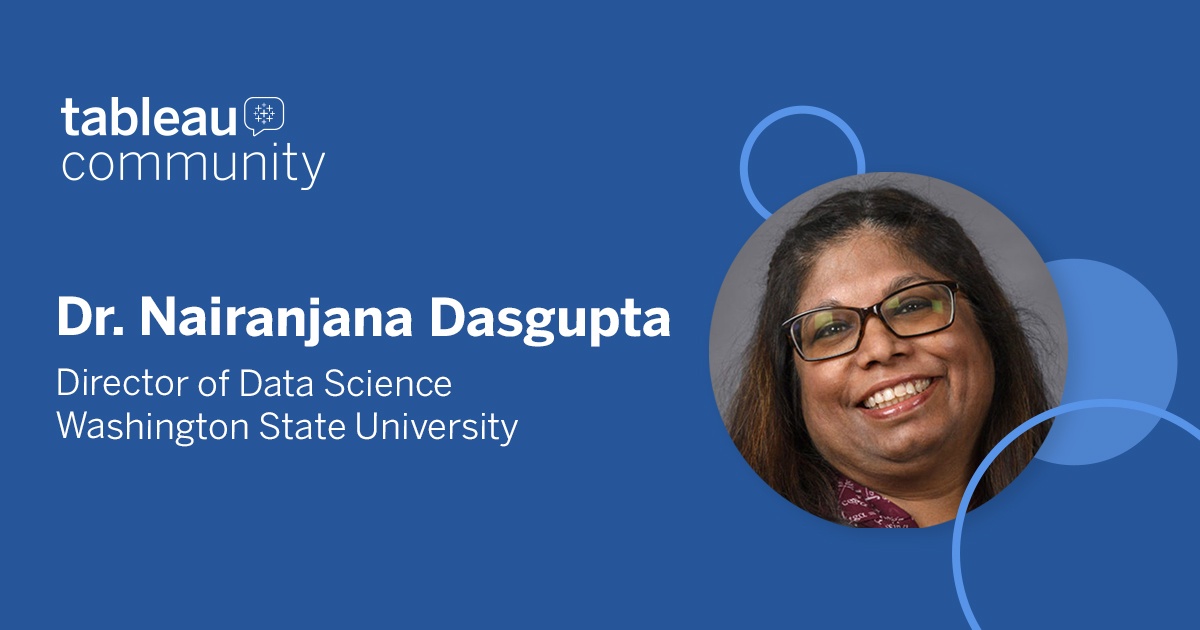
Our first spotlight is Dr. Nairanjana “Jan” Dasgupta—Director of Data Analytics, Boeing Distinguished Professor of Math and Science Ed., Professor of Statistics at Washington State University.
Do you mind sharing your personal journey around Data Literacy that brought you to this point today?
From childhood, I have loved two disciplines almost equally: literature (especially poems) and mathematics (especially numbers). I grew up bi-lingual but was just drawn to story-telling. I also loved finding patterns in numbers. So, after a couple of tough high-school years when I was choosing a major, statistics made sense. I had never had a statistics class before I picked it for a major and as soon as I started taking classes, I realized it was what I really wanted. It had the grammar of math, but the fluidity of literature and it was all about what I liked the most: finding patterns.
After my PhD (which was on developing methods to understand and reduce false positives) I was offered a job at Washington State University in the program of Statistics, which at that point was in the College of Agriculture. Part of my position was consulting/collaborating with people in the college and other colleges with their data. Therein started my love affair with data. Applying the methods that I had been trained in, but also realizing that data analysis wasn’t about just strict adhering to theorems, but common sense, understanding the story of the data were all important. My natural curiosity and love for trivia took over. If I dealt with a data set about hunter-gatherers in Africa, I wanted the back story, so I could understand the problem.
One thing I realized was to be a really effective data analyst, one had to have knowledge of the subject, intuition, common sense, and the ability to explain to an audience in simple terms the big picture. I found myself drawn towards interdisciplinary research. So much so that in 2014-2016 I spearheaded the formation of the Center of Interdisciplinary Statistics Education and Research at WSU and became its founding director. At the same time, WSU was looking at developing a BS degree in Data Analytics. I co-chaired that committee with the then chair of the Computer Science program.
The degree is unique in the sense that the students take classes from math, statistics, computer science, and a discipline of their choice. Again the idea was, data always arises from some situation in real life. It was important to understand the nuances of the field that the data was coming from. By definition anybody working with data (whether analysis or developing methods) you have to think in an interdisciplinary manner.
What are some of the initiatives that you have put into place at the University besides adopting Tableau for Teaching and why?
I have been fighting to introduce data literacy at all levels for a long time now. I have done professional development workshops on data literacy open for all graduate students and faculty. The idea was to demystify and de-jargon the field.
Changing the curriculum at a university (especially for an interdisciplinary program) is not easy. My approach since I took over as Director of Data Analytics, was, to use a cliche, to look at the data, of what was working and what wasn’t working for the end-product: our students. I allowed all the students in the program access to me and started talking with them and trying to figure out what they could learn from our program. As a lifelong researcher in quantitative research, I will come out and say, to understand human problems we need the text as well and the numbers.
One of the biggest issues is the word “interdisciplinary”. To use a cooking simile: academia often interprets it as a buffet, that students are getting “interdisciplinary” training if they are taking classes in different fields. However, what it really means is “fusion cuisine”. Taking x number of classes in statistics and y number of classes in computer science, doesn’t help the students as they cannot make the connections themselves. We cannot expect them to: they do not have the maturity to make connections when so many puzzle pieces are missing. What they need is for the faculty to come together and develop a REAL data class for them, academia really needs to understand that.
Something I have done in our program is trying to reduce barriers to entry. I just dropped Calculus 2 as a required class for the BS degree. Changes like these are hard, as it has to be a mindset change, not a superficial lip-service type of change. I have also worked on reducing the number of classes in the program and focused on real experiential learning. I worked hard to get our program endorsed as a Career Connected Learning program. I have been working to make sure our students get opportunities to work with companies like Amazon Microsoft and Boeing to solve real problems for their capstone. Giving them a chance to work on a team and take joint ownership of the problem at hand.
A tiny fraction of today’s workers use traditional High School math, but they do use data frequently.
At WSU I am building on a foundation that is highly collaborative and brings together multiple units and disciplines. Engineering, mathematics, statistics, and the domain areas all have a role to play, and have people passionate about these issues—also reaching out to education, arts, communication, and economics. The idea is there are people, like me, who are passionate about these ideas—giving them a forum.
By emphasizing the word “Literacy” I am hoping that it really helps push us beyond the confines of “analytics” or “science,” and challenges us to think about how we train non-experts as well as experts. We’ll never solve our workforce challenges—much less our citizenship challenges—around the use of data if we train only a particular kind of specialist.
Connect with Dr. Nairanjana “Jan” Dasgupta
Email: Dasgupta@wsu.edu
Historias relacionadas
Student to BI Analyst, How Tableau Can Lead to a Successful Data Career
 20 Marzo, 2024
Top 3 Visualizations, Iron Viz: Student Edition 2024
 13 Febrero, 2024

What is Iron Viz: Student Edition?
1 Diciembre, 2023
Suscribirse a nuestro blog
Obtenga las últimas actualizaciones de Tableau en su bandeja de entrada.