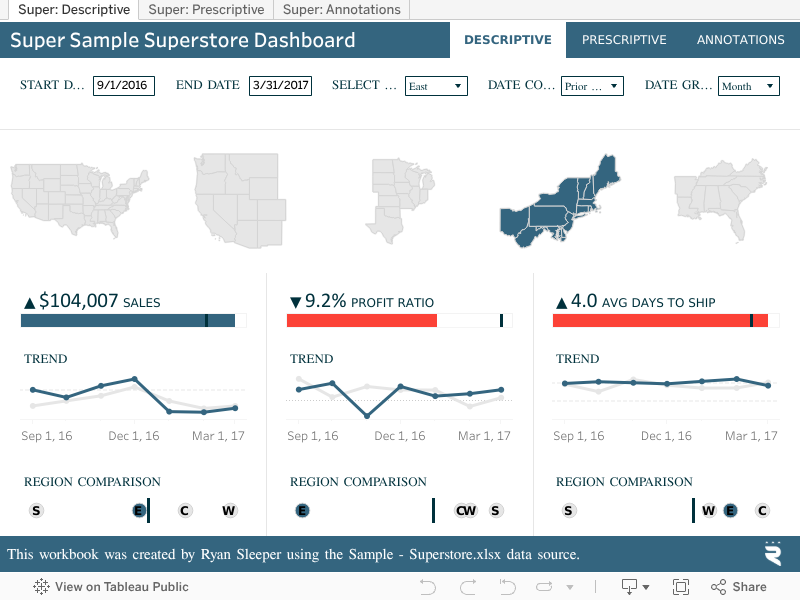
Super Sample Superstore
This corporate style viz is a different take on the classic Tableau Superstore data set. Quickly spot increases or decreases in sales, profit ratio, and shipping time, and switch to the Prescriptive tab to pinpoint the root cause. Created by Ryan Sleeper, this workbook aims to train users on design, data visualization strategy, and how to use Tableau to get the most out of any data set.
Create and share on Tableau Public
Join the newsletter and find daily inspiration with the Viz of the Day. Yours could be featured next!
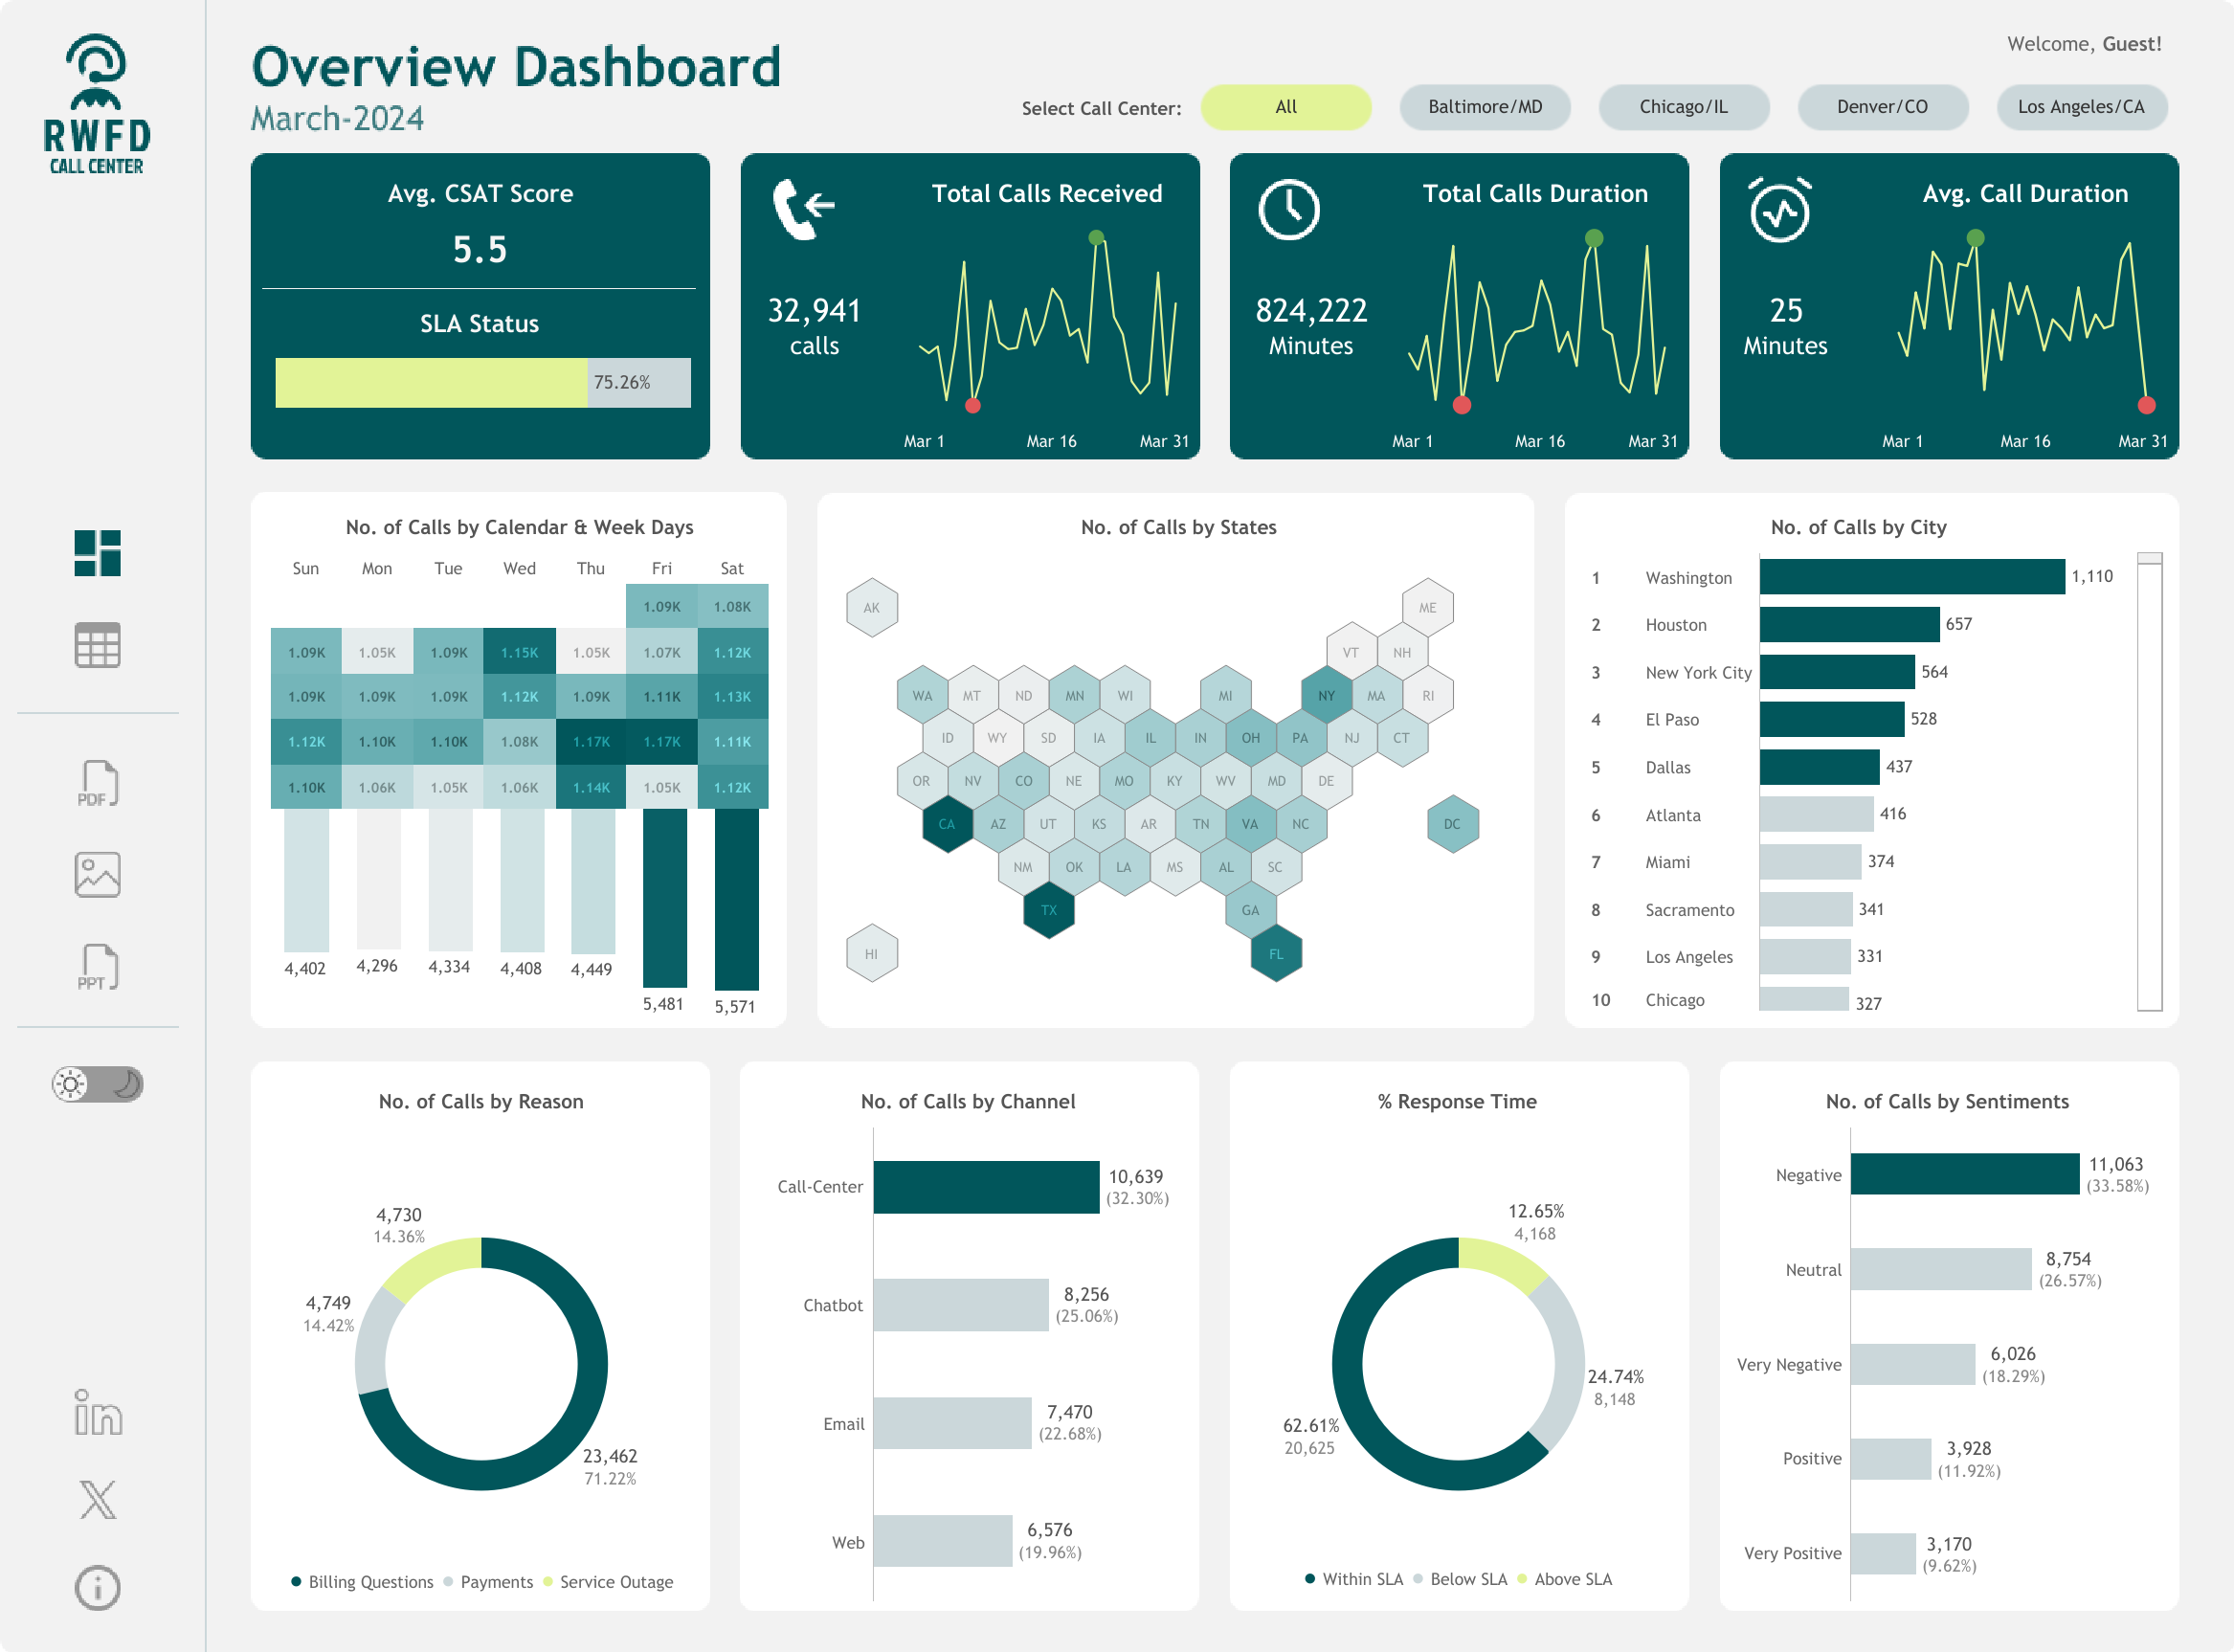
Call Center Dashboard
Get into call center insights with this #VizOfTheDay—a #RWFD entry by Waqar Ahmed Shaikh. Toggle between light and dark modes and analyze total calls, duration, response time, and more. Viz inspired by Gander Goldestan, and Ahmed Shyam.
Interact with the viz