How visualizing quantified self data can help you find meaning in a quarantined world


"What are people doing during quarantine to pass the time? According to a text mining analysis conducted by Feng Lim of Towards Data Science, people are using Tik Tok, playing games, and reading more in an effort to stave off boredom. Others have turned to data visualization.
Data is everywhere—our phones track our steps and screen time, our smartwatches track our heartbeat throughout the day and hours of sleep at night, and our apps track our spending, nutrition, and productivity. Many in the Community are using this “quantified self” data to better understand the effects of Coronavirus (COVID-19) on their day-to-day.
How have your spending habits changed? Are you tracking your exercise? Analyzing your personal data can help you to answer questions about your health, achieve your goals, or learn something new."
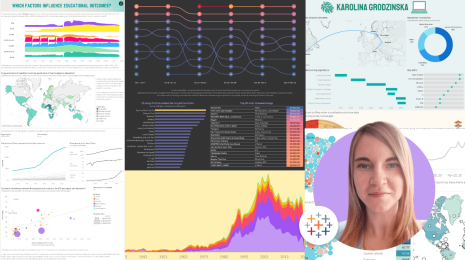
Read on to see how Tableau Public authors are visualizing their own data and how you can find meaning in your personal data.
Autres sujets pertinents
Student to BI Analyst, How Tableau Can Lead to a Successful Data Career
 20 mars, 2024
Top 3 Visualizations, Iron Viz: Student Edition 2024
 13 février, 2024

What is Iron Viz: Student Edition?
1 décembre, 2023
Abonnez-vous à notre blog
Recevez toute l'actualité de Tableau.