The New Zealand Electricity Authority makes data analytics more accessible
With 75 users and counting, Tableau has helped to improve the accessibility of analytics and supports a data-driven culture
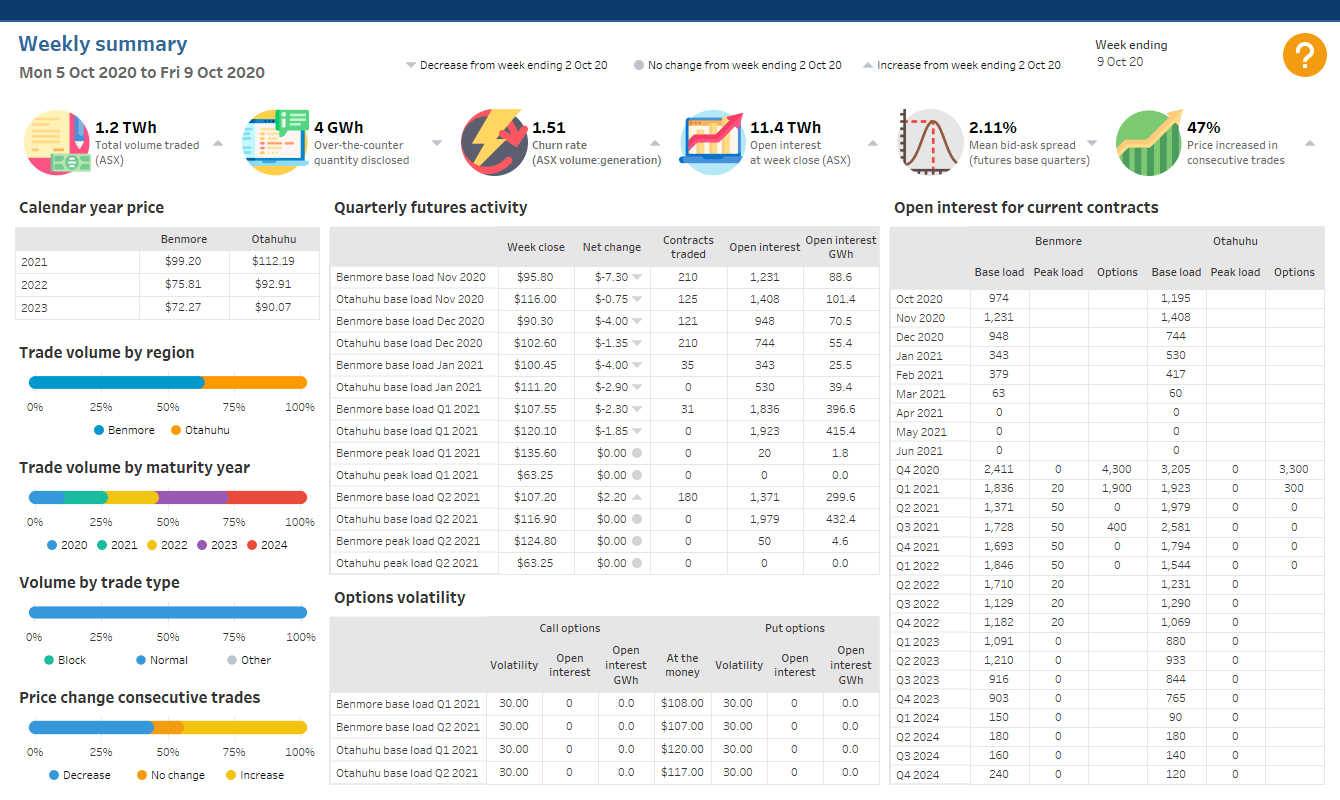
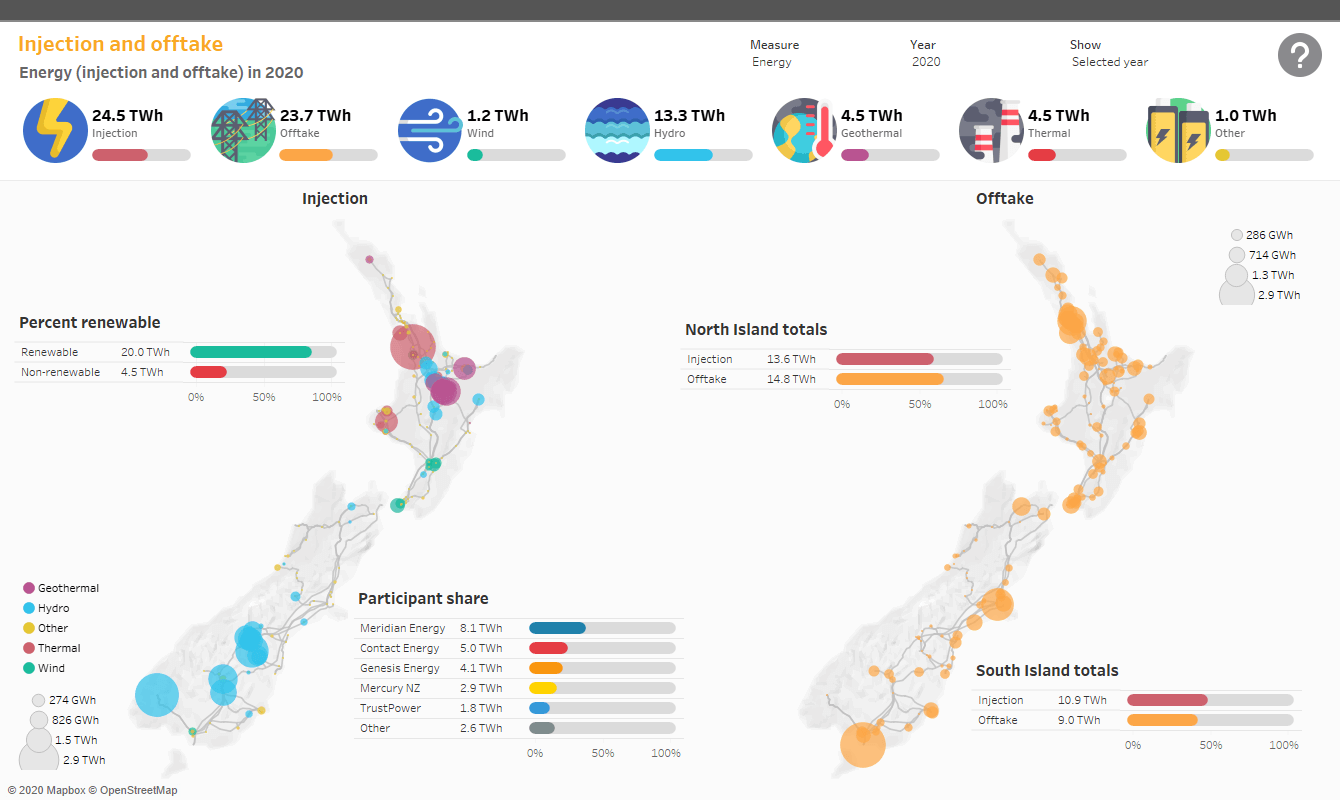
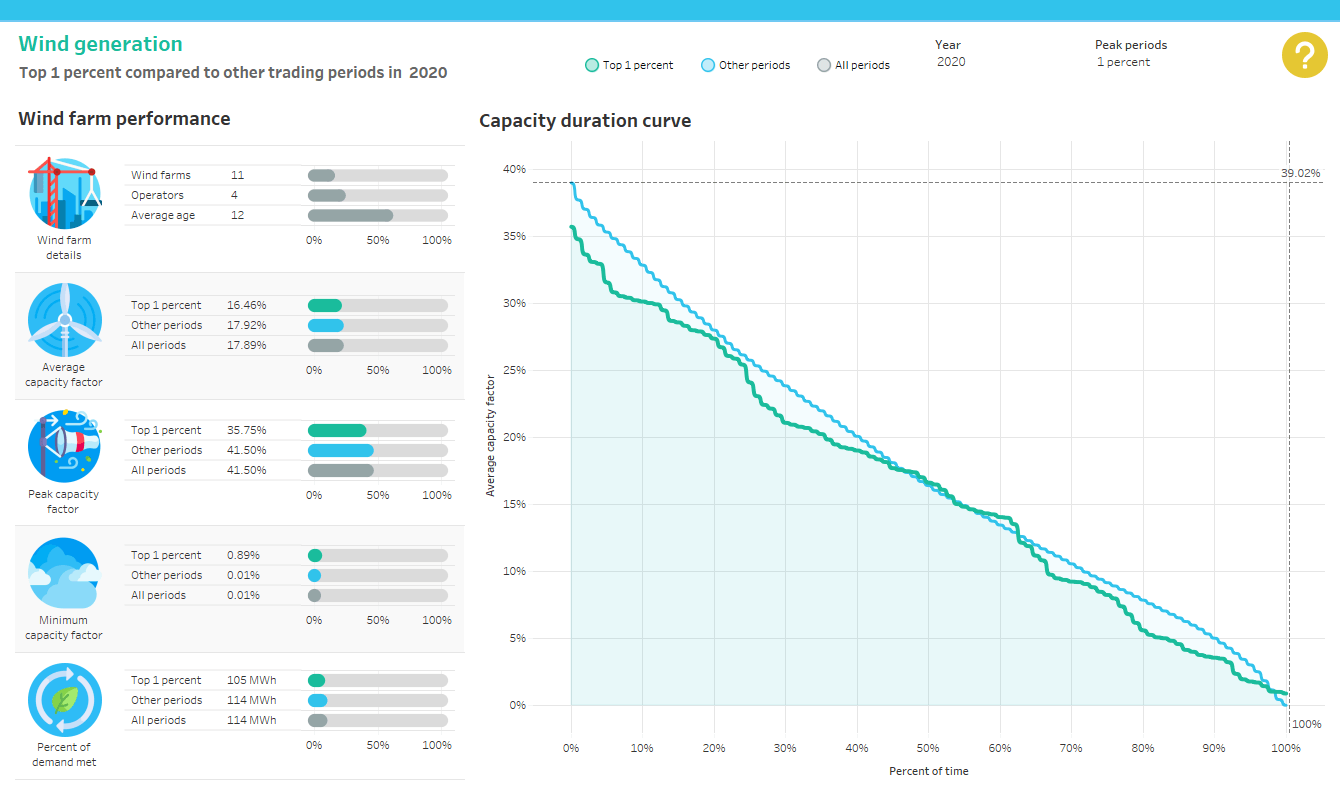
145 visualizations inform decisions on policy and operational matters such as finance
Complicated dashboards can be completed in half a day as compared to the weeks it took previously
The New Zealand Electricity Authority is responsible for the efficient operation of the country’s electricity market. This involves designing and administering market rules that promote competition and ensure a reliable supply of electricity to consumers.
To ensure the effectiveness of these rules, the regulator has a dedicated market analytics team that monitors compliance with existing regulations and models the impact of future ones. In the past, most of this analysis was carried out using programming tools or complicated spreadsheet formulas. However, as the regulator came to rely more on data, it needed a different approach.
“We have people doing very advanced analysis on their own, but if they’re not here, no one else can work with that data. We wanted a more consistent approach and to make the analysis more accessible,” said Todd Gillies, Senior Business Intelligence Analyst at the Electricity Authority.
Introducing Tableau has helped to solve this challenge. It has given the market analytics team powerful visualization capabilities while also meeting the data needs of finance and other areas of the organization.

Driving deeper analysis
For the market analytics team, one of the most significant advantages of using Tableau has been the ability to analyze large datasets and drill down into the details more easily.
“Some of our datasets go back to the 1990s, and while it is easy enough for our team to write an SQL query and put the results up on a dashboard, you also want to be able to access all of that data in the background,” said Gillies. “The performance of Tableau makes it easier to do that deeper analysis.”
The team also relies on Tableau to monitor what’s happening in the current market. One recent example is a visualization created for COVID-19. The regulator was concerned about the financial impacts of the pandemic on both consumers and suppliers and wanted to be ready in case it had to intervene with a new policy.
“We were able to bring a number of data points into Tableau so we could closely monitor the situation and step in at any time we started to see excess disconnections or any financial impacts on suppliers,” said Gillies. “At the end of the day, there was no major policy change required, but that’s a good outcome. We aim for minimal intervention, and we can better achieve that by making decisions based on data.”
We were able to bring a number of data points into Tableau so we could closely monitor the situation and step in at any time we started to see excess disconnections or any financial impacts on suppliers.
Creating a data-led culture
While the market analytics team’s primary focus is policy, it has become the go-to team for others wanting analytics and advanced reporting. “Other teams like finance have seen what we’re doing with Tableau and come to us with their use cases. As a small organization, we’ve been happy to help, and it has been a good opportunity to connect with different teams and collaborate on data,” said Gillies.
There are now 75 people using Tableau across the Electricity Authority, and they have created a total of 145 visualizations. These visualizations include dashboards used to inform policy as well as those used for finance and board reporting.
To embed this data culture, Gillies has run internal training alongside Montage, the partner who helped deploy Tableau for the regulator. Gillies himself is also involved in the user groups organized by Montage and brings best practices back to the organization. And while he and his team are still the go-to for producing visualizations, he said Tableau was intuitive for others to use.
“I think most people find it easy to navigate their way through, and we try to help by producing visualizations in a consistent way,” said Gillies.
The next step in the regulator’s data journey is to move its instance of Tableau Cloud from the data centre in the US to the data centre in Australia. While not required for compliance, Gillies said it made sense for all of its data warehouses to be located in one place and closer to home.
In talking about the future of analytics more broadly, Gillies said he hopes to see data become more central to decision making within the electricity industry. The Electricity Authority’s EMI website supports this by making analytics tools available to the whole of the industry. This includes dashboards which are prototyped in Tableau, shaving weeks off development time.
“A lot of times decisions will be made without data, and I think one of the challenges is visibility. So by bringing everything together in one central place, we can help people think through potential decisions and what the impacts will be,” said Gillies.
![]()