Oneflare leverages a single source of truth to increase sales revenue by 270%
Increased sales volume by 81% per salesperson, resulting in a 270% increase in overall revenue
300 hours a year saved on the calculation of commissions
Improved accuracy of forecasts, enabling better budgeting and more informed decisions related to activities such as hiring and marketing investments
Oneflare is an Australian start-up that connects customers to businesses across 300 categories, ranging from plumbers and electricians to pet groomers and interior designers. As a rapidly scaling business, Oneflare relies on data to make key decisions such as when to hire, where to invest, and how much to charge. The business also uses data to engage and focus its team, and it has sent sales soaring through its use of gamification.
Tableau is central to Oneflare's data culture. It brings together nearly 130 data sources into a single source of truth and has increased efficiency and visibility of performance. It has also helped to achieve triple digital revenue growth.
As a start-up, it's ingrained in our culture that everyone knows and understands our higher business goals and how they contribute to them. With Tableau as our single source of truth, everyone is more aligned on these KPIs.

Data-led decision making drives sales and marketing performance
Before adopting Tableau, Oneflare was using numerous platforms and channels for analysis and reporting, which made it difficult to measure and forecast performance accurately. In addition, there was increasing pressure on Oneflare's Insights team as they responded to growing requests for new reports and different views of data. The business sought a solution that would simplify data analytics and empower everyone to do more analysis and discovery on their own.
Oneflare chose to implement Tableau because of its flexibility and also its simple and intuitive interface. It made it easy for everyone to move between a macro and micro view of their data and find answers to different questions. It also enabled greater visibility of performance and alignment around the business' KPIs.
"As a start-up, it's ingrained in our culture that everyone knows and understands our higher business goals and how they contribute to them. With Tableau as our single source of truth, everyone is more aligned on these KPIs,"Marco Maizener, Head of Insights at Oneflare.
Oneflare now has 205 custom workbooks in Tableau which help it to understand customers on both sides of its marketplace and to pull the right levers to balance supply and demand. For example, with a view of uptake across categories, it can make strategic decisions about pricing and identify where to direct its sales and marketing efforts.
Oneflare is also using Tableau to motivate the sales team by blending performance data from multiple sources and presenting it in a gamified view. This has helped to drive healthy competition amongst reps and contributed to an 81 percent increase in sales volume per sales rep and a 270 percent increase in revenue.
The performance of marketing has also been improved as a result of being able to drill down into past campaigns to understand how these can be optimised in the future. For instance, the marketing team can now see which channels work best for promoting different categories on the Oneflare site. They can also optimise their Search Engine Marketing.
Riley Spratt, Marketing Specialist at Oneflare, said Tableau's visualisations were invaluable in stitching together data from multiple channels and extracting more significant insights.
For the first time, I have a 360 degree view of all our campaigns and activities, and we also have alerts to tell us when there are issues, and our automated email campaigns are not working.
Increasing efficiency and insight
Oneflare's marketing team is one of several that has benefited from the efficiency Tableau provides. It takes just minutes to visualise the performance of individual campaigns, and the team has saved one day per week on reporting.
Another area where Oneflare has saved time is on the calculation of commissions. Prior to using Tableau, this process involved multiple reports and spreadsheets and took a minimum of four full working days to complete. Now, it takes less than four hours per month, saving 300 hours per year. Testing of Oneflare's data pipeline has also been made easier as Tableau is able to handle better the large amount of data generated by the marketplace.

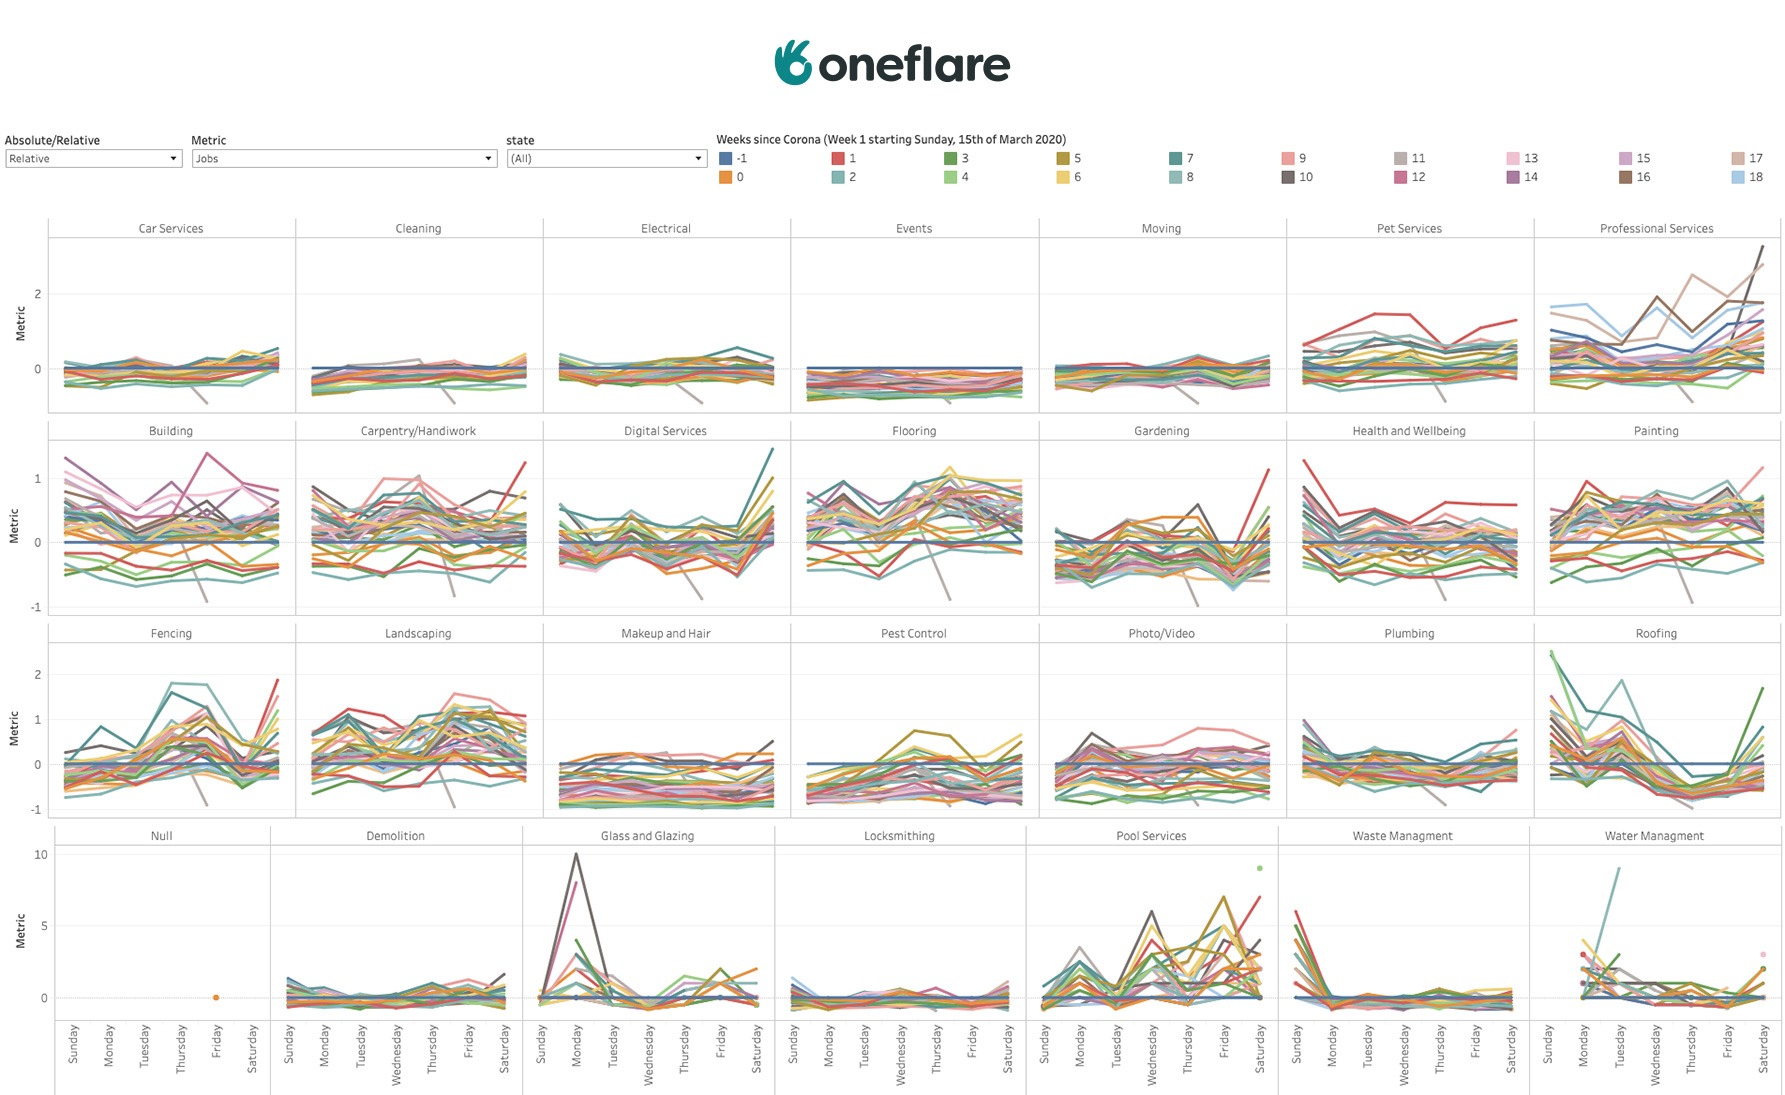
The efficiencies gained through these use cases and others help Oneflare to work more productively and focus on growing the business. Oneflare is tapping into additional insights from Tableau to streamline the customer journey and eliminate potential points of drop off. It has also developed a Coronavirus Crisis dashboard to track newly relevant metrics and keep on top of shifts in the market.
Financial forecasting is another priority and Oneflare is using Tableau together with Python to make more accurate predictions about customer lifetime value and monthly results. "Our goal now is to increase our financial data maturity and move from analysing data to predicting data. That's the future, and that's our next step," said Maizener.