DataFam Roundup: November 29 - December 3, 2021


Dig into the latest DataFam Roundup—a weekly blog that brings together community content all in one post. As always, we invite you to send us your content—and the DataFam content from your peers that have inspired you! Find the content submission form here.
DataFam content
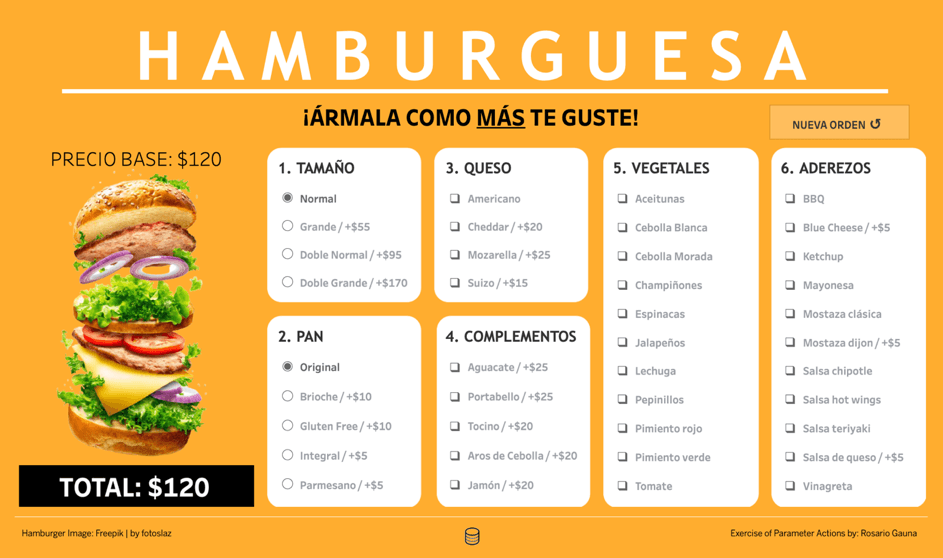
Rosario Gauna, RosarioViz: Create Your Own Burger with a Parameter
Dive into content created by the Tableau Community:
- Tim Ngwena, Tableau Tim: Closing out 2021 & BIG changes for 2022
- Rosario Gauna, RosarioViz: Create Your Own Burger with a Parameter
- Steve Adams: "Can you just put this Excel spreadsheet in Tableau for me ?"
- Annabelle Rincon, Rativiz: How to create an Advent Calendar in Tableau?
- Steve Wexler, Data Revelations: Decluttering by making the first row different from the other rows
- Pablo Gomez, Data Monster Project: #GOT and The Women of Ice and Fire
- Ken Flerlage, The Flerlage Twins: QGIS for Tableau Users # 4: What’s Nearby?
- Ritesh Bisht, Ritesh is Dancing with Data: Tableau Interview (Real-Time/Hands-On)Question 3- What is Context Filter ?
- Marc Reid, Datavis: Show only Selected Countries in a Background Map
- Nicole Klassen: Building a Network Graph in Tableau
- Sunil Bhardwaj: Lesson 4: Tableau CRM Data Integration Basics
- Katie Kilroy, Data Katie: Why You Should Participate in the Tableau Community Forums
- Andy Cotgreave: My favorite data books of the year
- Andy Kirk: Best of the visualisation web july 2021
- Sekou Tyler, SQLSekou: How to remove duplicate values with Tableau Prep and Power Query
- Mark Bradbourne, Just 5 Minutes Podcast
- Sean Miller, HipsterVizNinja: #WOW2021 | Week 48 | #Tableau | Live Stream
- Kavitha Parthasarathy: What is Tableau Business Science?
- Jock Mackinlay, Tableau: Analyzing the history of Tableau innovation
Upcoming events and community participation
- Buddy Talks, December 4, 2021, 4pM IST: Leveraging Tableau Containers
- Stay up to date with the latest and greatest from the Tableau Community. We'll help you along in your Tableau journey, bring your data skills to the next level, and nurture powerful connections.
- Final voting is now open for the 2021 Data Literacy Awards.
- Tableau's Next Nominee Form: Share who you think should be considered in Tableau's Next. Please note this is a list of people newer to the community who are not yet Zen Masters or Ambassadors, but have been doing incredible work.
Vizzes
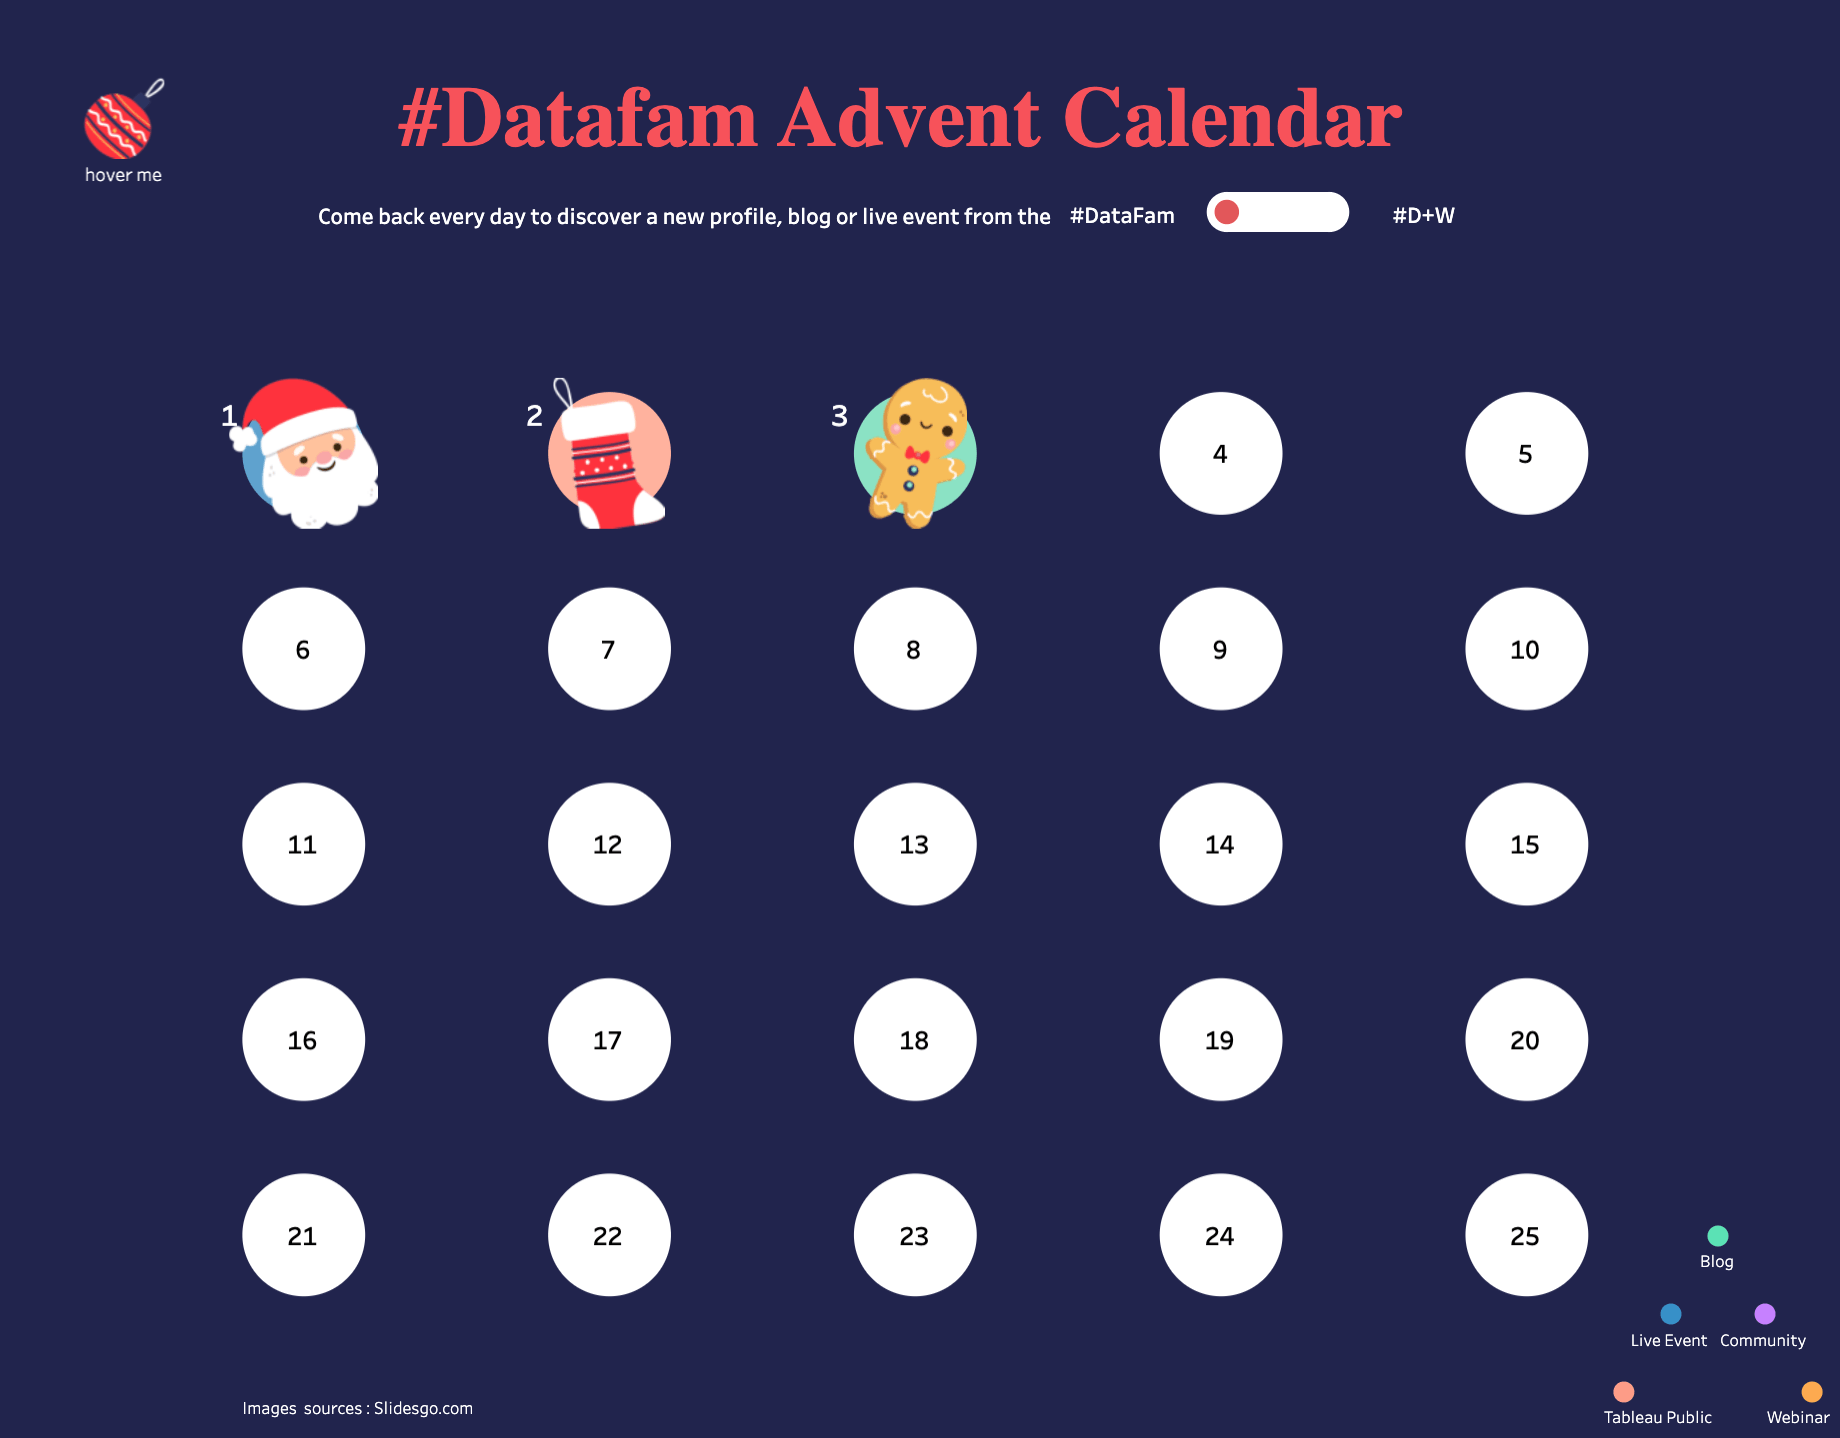
Annabelle Rincon: Advent Calendar Datafam
Catch this week’s Viz of the Days here and subscribe to get them emailed directly to your inbox.
Check out some inspirational vizzes created by the community:
- Bold Batdorj: Youth employment rate ranked by ethnicity in London
- Rob Hawke: Simpsons Ratings In Homer's Likeness
- Jessica Moon: Thanksgiving Spread for #B2VB
- Annabelle Rincon: Advent Calendar Datafam
- Matt Francis: The Tableau World Advent Calendar
- Vi: Harry Porter in a Nutshell
- Frederic Fery: Monty Python's Flying Circus 10,000 dialogues
Community Projects
Back 2 Viz Basics *NEW!
A bi-weekly project helping those who are newer in the community and just starting out with Tableau. Not limited just to newbies!
Web: Back 2 Viz Basics
Twitter: #B2VB
2021 Teaser: Build Your Best Bar Chart
Games Night Viz *NEW!
A monthly project focusing on using data from your favorite games.
Web: Games Nights Viz
Twitter: #GamesNightViz
November - December 2021: Level 1: Player Select
Workout Wednesday
Build your skills with a weekly challenge to re-create an interactive data visualization.
Web: Workout Wednesday
Twitter: #WOW2021
Week 48: Coaches’ Favorite Challenges Advent Calendar
Preppin' Data
A weekly challenge to help you learn to prepare data and use Tableau Prep.
Web: Preppin’ Data
Twitter: #PreppinData
Week 41: Southend Stats
Iron Quest
Practice data sourcing, preparation, and visualization skills in a themed monthly challenge.
Web: Iron Quest
Twitter: #IronQuest
October 2021: Viz a Year or Decade
Storytelling with Data
Practice data visualization and storytelling skills by participating in monthly challenges and exercises.
Web: Storytelling with Data
Twitter: #SWDChallenge
December 2021: cheers to the holidays
Project Health Viz
Uncover new stories by visualizing healthcare data sets provided each month.
Web: Project Health Viz
Twitter: #ProjectHealthViz
December 2021: Trends in Youth Sports
Diversity in Data
An initiative centered around diversity, equity & awareness by visualizing provided datasets each month.
Web: Diversity in Data
Twitter: #DiversityinData
November - December 2021: The countdown to Christmas and New Year!
SDG Viz Project
Visualize data about Sustainable Development Goals provided by the World Health Organization.
Web: SDG Viz Project
Twitter: #TheSDGVizProject
Sports Viz Sunday
Create and share data visualizations using rich, sports-themed data sets in a monthly challenge.
Web: Sports Viz Sunday
Twitter: #SportsVizSunday
November 2021: Tableau Conference
Viz for Social Good
Volunteer to design data visualizations that help nonprofits harness the power of data for social change.
Web: Viz for Social Good
Twitter: #VizforSocialGood
Nov 28, 2021 - Jan 7, 2022: visualize our community
Real World Fake Data
Create business dashboards using provided data sets for various industries and departments.
Web: Real World Fake Data
Twitter: #RWFD
Viz 2 Educate
Each month, create vizzes on global education syllabus topics as resources for teachers worldwide.
Web: Viz 2 Educate
Twitter: #Viz2educate
Makeover Monday
Join the community every Monday to work with a given data set and create better, more effective visualizations.
Web: Makeover Monday
Twitter: #MakeoverMonday
관련 스토리
DataFam Roundup: April 8–12, 2024
 2024/04/12
DataFam Roundup: April 1–5, 2024
2024/04/05
DataFam Roundup: March 25–29, 2024
2024/03/29
Subscribe to our blog
받은 편지함에서 최신 Tableau 업데이트를 받으십시오.