DataFam Roundup: September 6 - 10, 2021


Dig into the latest DataFam Roundup—a weekly blog that brings together community content all in one post. As always, we invite you to send us your content—and the DataFam content from your peers that have inspired you! Find the content submission form here.
DataFam content
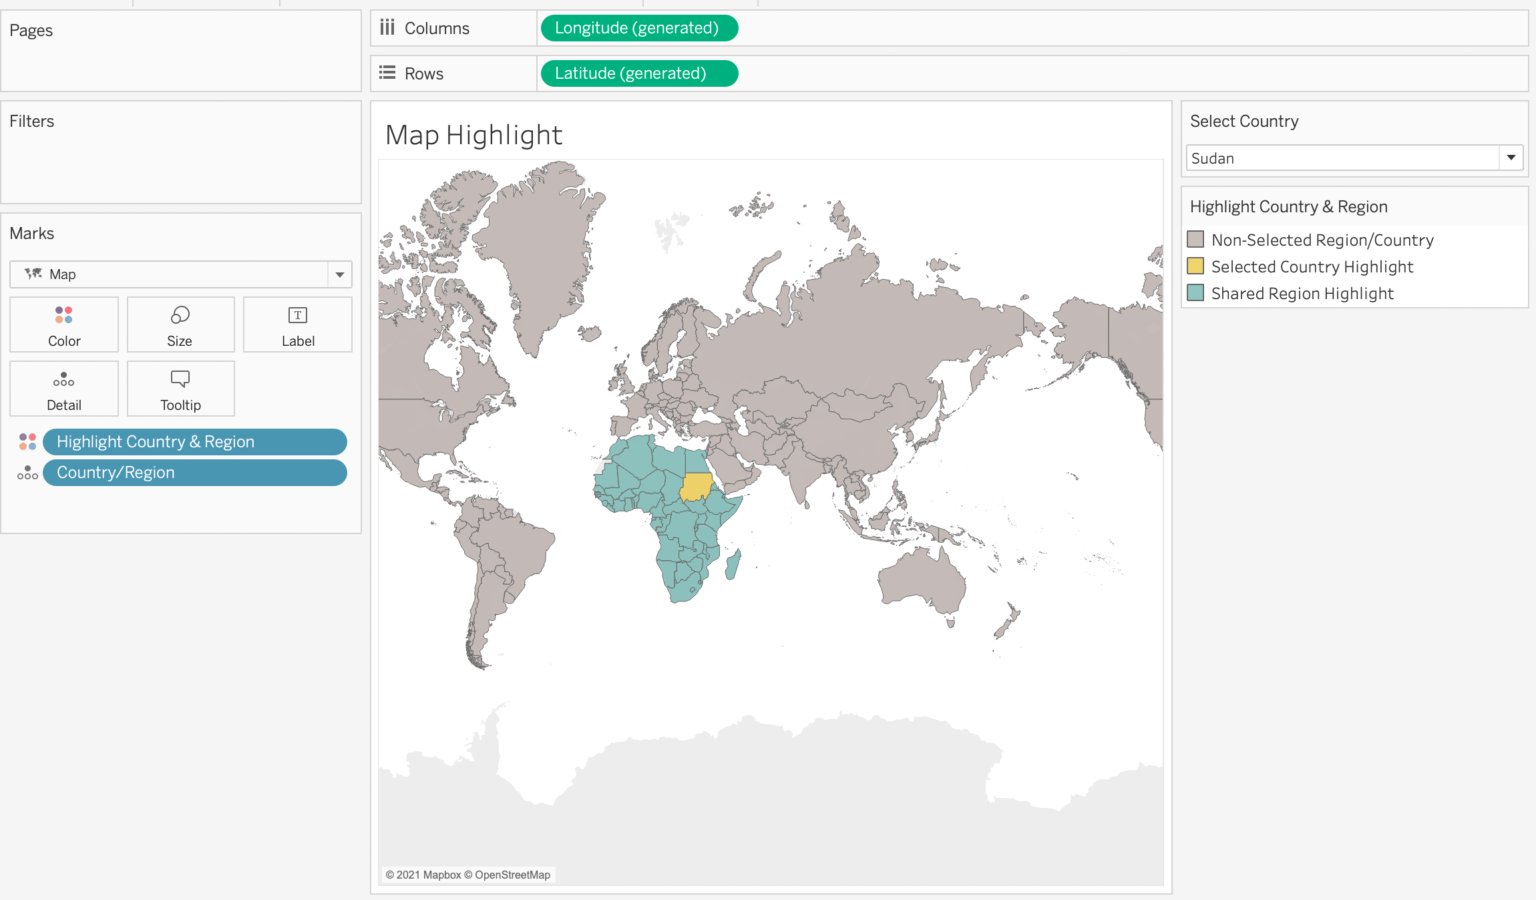
Darragh Murray: Fun with sets: Highlighting/filtering data using a shared attribute of a selected value in Tableau
Dive into content created by the Tableau Community:
- Alex Eskinasy: Create a Persistent Tableau Server Docker Container in 30 minutes
- Ryan Sleeper, Playfair Data TV: How to Make a Custom Polygon Map in Tableau
- Kevin Flerlage featuring Julie Laux, The Flerlage Twins: Guest Blog Post: Rapid Dashboarding - 5 Steps to Success
- Cole Nussbaumer Knaflic, Storytelling with Data: unsolicited feedback
- Dzifa Amexo featuring Anita Onyeacho, as dzif: On the DL(L): Learning Tableau, Dream Jobs, & Jollof | Episode #1
- Jeff Plattner: Start Saving Time with this Tableau Dashboard Templates Workbook
- The Information Lab featuring Adam Mico and Priya Padham, Talk Data: What we’ve learnt from 20+ Datafam Interviews
- Darragh Murray: Fun with sets: Highlighting/filtering data using a shared attribute of a selected value in Tableau
- Tanushree Rohera: Connecting Druid to Tableau
- Kristi Brown, Force for Fun: Show Dynamic Columns Based on Today’s Date in Tableau CRM
- Hannah Murphy, The Data School: An Introduction to Salesforce
Upcoming events and community participation
- Data Book Club, Fall 2021 Edition: This fall Data Book Club will be reading The Adaptation Advantage by Heather McGowan and Chris Shipley. "While not specifically about data, the book will get us to think outside the box and challenge our approach to data." Learn more and sign up.
- September 17th, 10 AM CT – 11.00 AM CT: Join the third session of the Cup of Data series to expand on your Tableau CRM skills. The product team will demo their latest and greatest in a 'Release Jam'. Register for the event.
- Black Cinema Viz Challenge: Black Cinema Data Sets 2000-2021, instructions and links are provided upon registration
- Are you a visualization and storytelling expert? Enter the Data Viz Competition to showcase your data-driven artistic skills while competing for top prizes!
- Data Visualization: State of the Industry 2021: The purpose of this survey is to help the Data Visualization Society and the broader data visualization community understand the state of data visualization, the people who make it, the challenges they face, what can help practitioners, and where the field is headed.
Vizzes
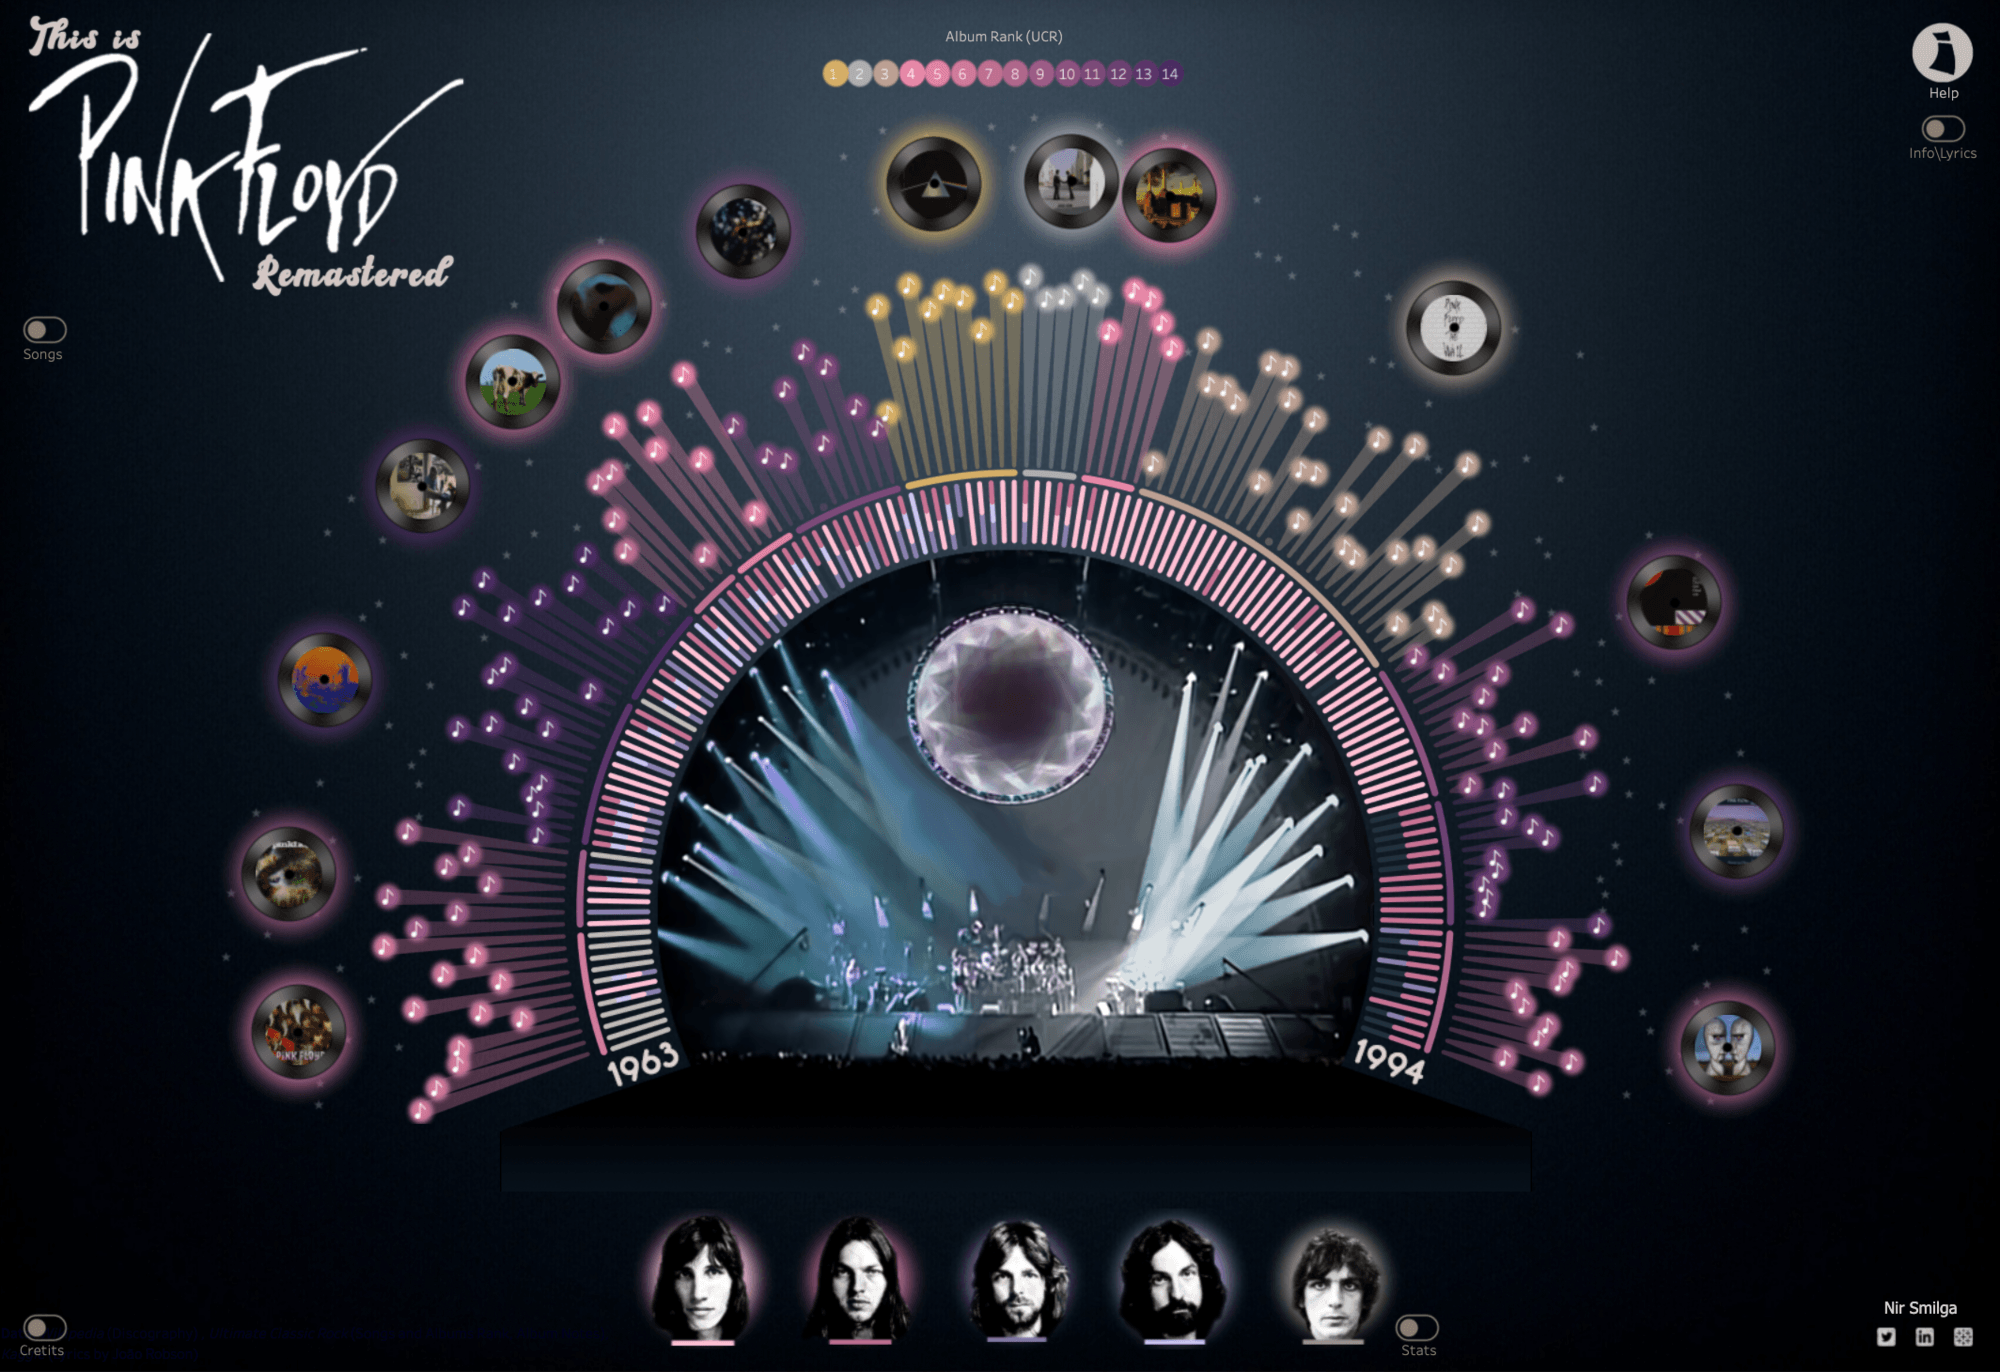
Nir Smilga: This is Pink Floyd -Remastered
Catch this week’s Viz of the Days here and subscribe to get them emailed directly to your inbox.
Check out some inspirational vizzes created by the community:
-
Zak Geis: Lights Off (Dark Mode) - Design Tip
-
Priyanka Dobhal: If the world was ending
-
Saverio Rocchetti: Tarantino
- Nir Smilga: This is Pink Floyd -Remastered
-
Joti Gautam: PokeMon: PokeDex (1-20) of Gen One
-
Will Sutton: Where to Pass the Great British Driving Test
-
Priyanka Dobhal: Movies based on Cinderella
Community Projects

Makeover Monday
Join the community every Monday to work with a given data set and create better, more effective visualizations.
Web: Makeover Monday
Twitter: #MakeoverMonday
Week 36: What do Americans think about abortion?
Workout Wednesday
Build your skills with a weekly challenge to re-create an interactive data visualization.
Web: Workout Wednesday
Twitter: #WOW2021
Week 36: When do extracts run during the day?
Sports Viz Sunday
Create and share data visualizations using rich, sports-themed data sets in a monthly challenge.
Web: Sports Viz Sunday
Twitter: #SportsVizSunday
September 2021: Sporting Heroes & Legends
Iron Quest
Practice data sourcing, preparation, and visualization skills in a themed monthly challenge.
Web: Iron Quest
Twitter: #IronQuest
September 2021: Sporting Heroes & Legends
Storytelling with Data
Practice data visualization and storytelling skills by participating in monthly challenges and exercises.
Web: Storytelling with Data
Twitter: #SWDChallenge
September 2021: envision education
Project Health Viz
Uncover new stories by visualizing healthcare data sets provided each month.
Web: Project Health Viz
Twitter: #ProjectHealthViz
September 2021: Biggest Healthcare Data Breaches
SDG Viz Project
Visualize data about Sustainable Development Goals provided by the World Health Organization.
Web: SDG Viz Project
Twitter: #TheSDGVizProject
COP26 UN Climate Change Conference: #VIZ4CLIMATEACTION
Preppin' Data
A weekly challenge to help you learn to prepare data and use Tableau Prep.
Web: Preppin’ Data
Twitter: #PreppinData
Week 33: Excelling at adding one more row
Real World Fake Data
Create business dashboards using provided data sets for various industries and departments.
Web: Real World Fake Data
Twitter: #RWFD
Dataset #12: Hospitality
Viz 2 Educate
Each month, create vizzes on global education syllabus topics as resources for teachers worldwide.
Web: Viz 2 Educate
Twitter: #Viz2educate
Topic: Microbiology
Diversity in Data
An initiative centered around diversity, equity & awareness by visualizing provided datasets each month.
Web: Diversity in Data
Twitter: #DiversityinData
August 2021: Refugee Data
Viz for Social Good
Volunteer to design data visualizations that help nonprofits harness the power of data for social change.
Web: Viz for Social Good
Twitter: #VizforSocialGood
관련 스토리
DataFam Roundup: April 8–12, 2024
 2024/04/12
DataFam Roundup: April 1–5, 2024
2024/04/05
DataFam Roundup: March 25–29, 2024
2024/03/29
Subscribe to our blog
받은 편지함에서 최신 Tableau 업데이트를 받으십시오.