Investigate claims interactively to see patterns for action
Does a claim submitted by a physician have a different claim paid ratio than those submitted by phone or web? You bet. Is it valuable to dig into these differences to make more informed decisions? Absolutely.
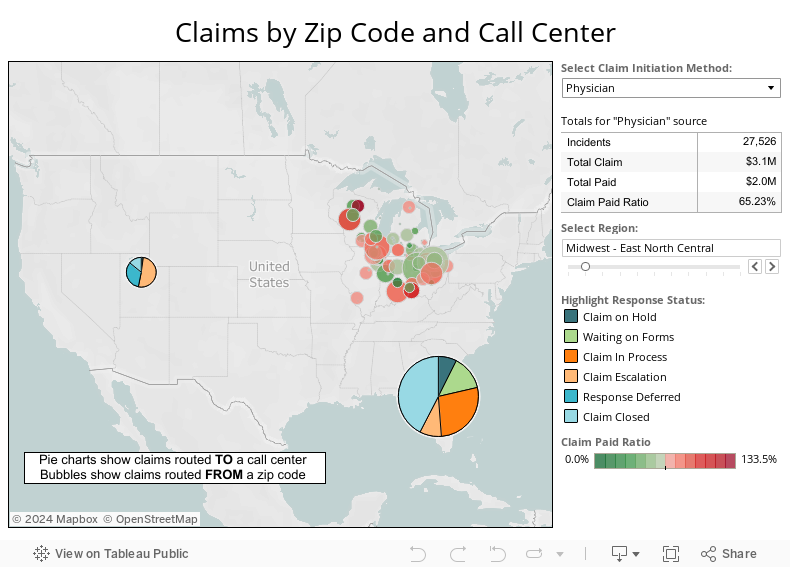
Don’t stop there. Couple this claims information with other salient data. Which call centers are processing the claims? How does claim status vary by region, by call center?
Insights such as these, illustrated in the visualization to the right, help managers, brokers and administrators alike quickly identify where they can optimize call center resources, improve claims processing procedures and identify potentially fraudulent patterns.
Click on the visualization to see how claims status varies by region and how the claim was initiated.