
Explore Tableau Blueprint: Community
Communicate with, engage, and support your data enthusiasts
Community creates a network of users within your organization who share enthusiasm for putting data at the center of every conversation. This helps continue to drive adoption and learnings around analytics and insights through collaboration and sharing. The Community workstream is focused on enabling user growth and evangelizing analytics through communications, engagement activities, and support.
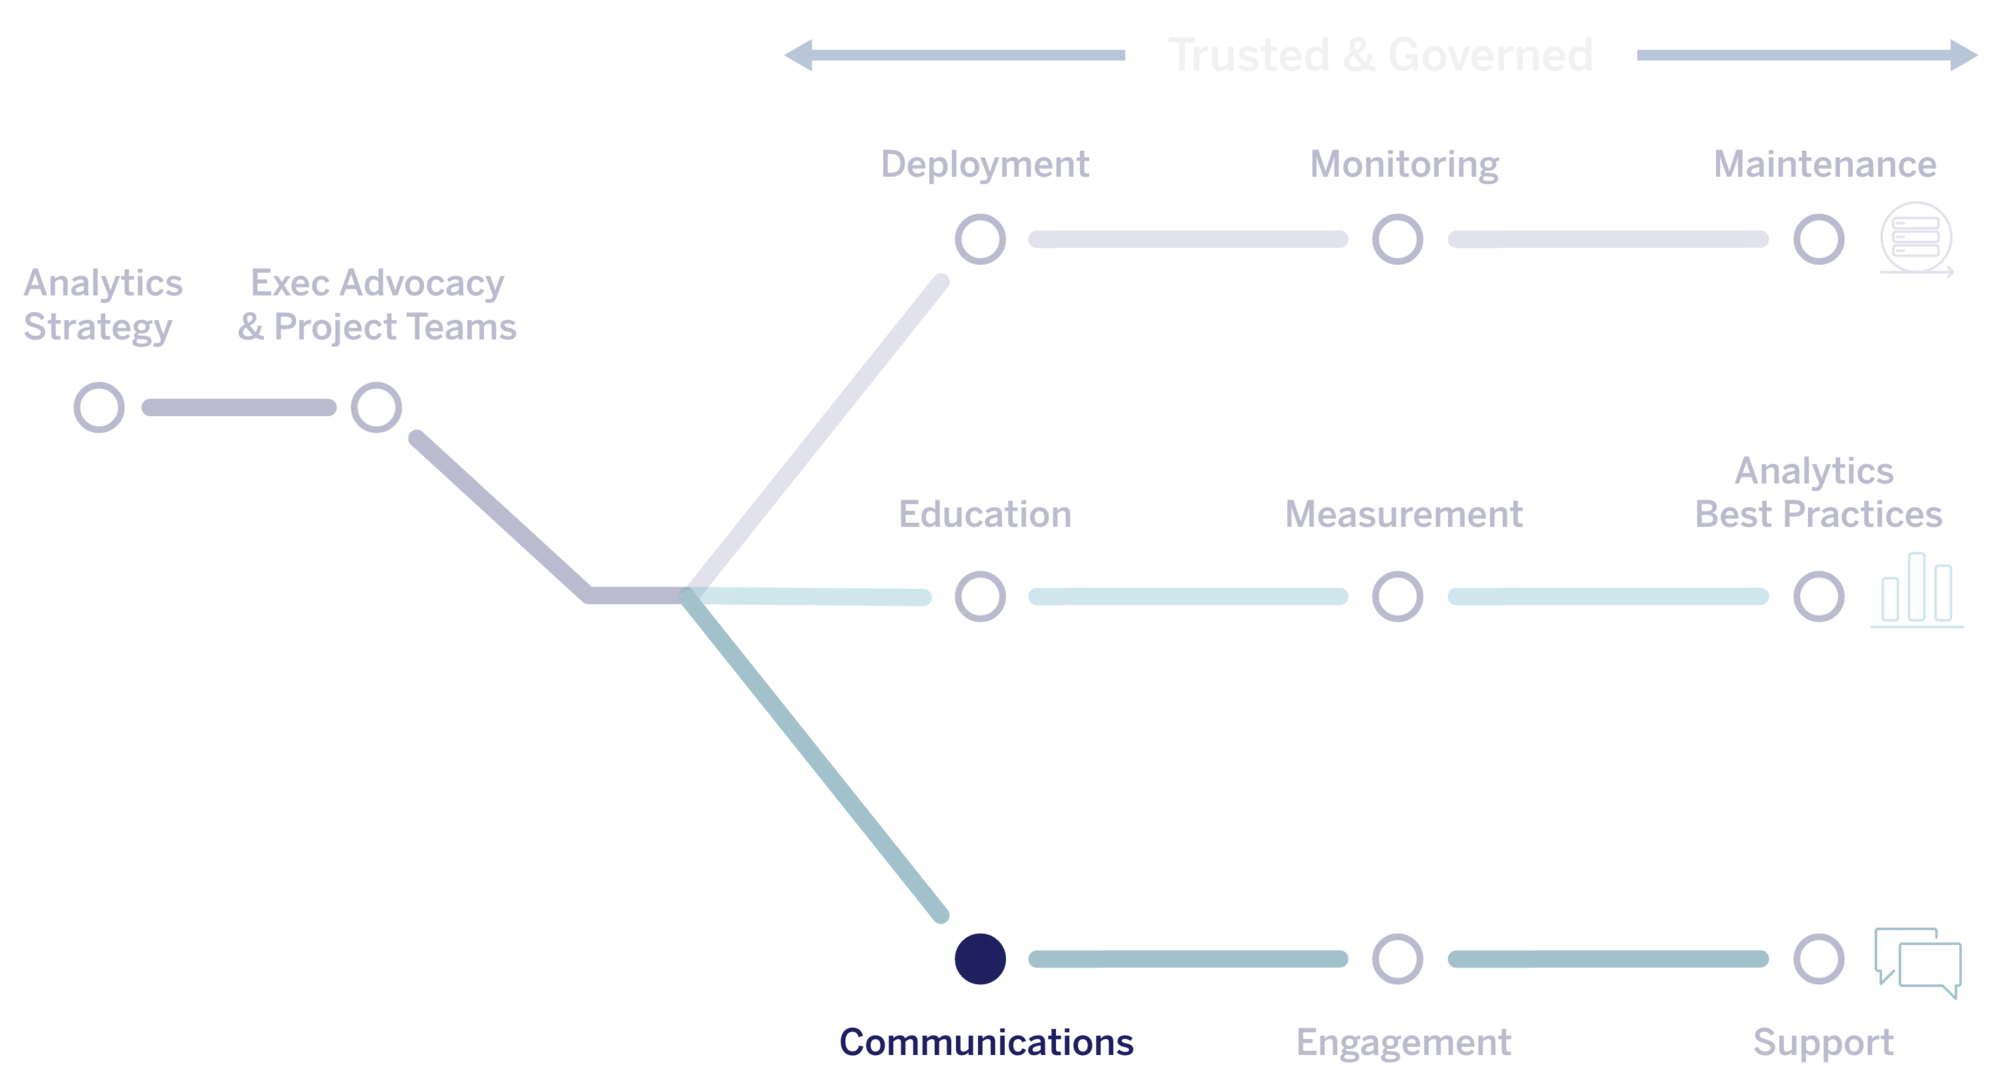
Communications
You’ll establish internal communications and enablement resources to guide people in learning and usage. With a well-defined communications plan, you’ll proactively nurture the use of data and analytics across all skill levels, minimize the resources needed to answer common questions, and bring together other Tableau users within the company.
This topic covers:
- Enablement intranet
- Blog and newsletter
- Discussion forums and chat
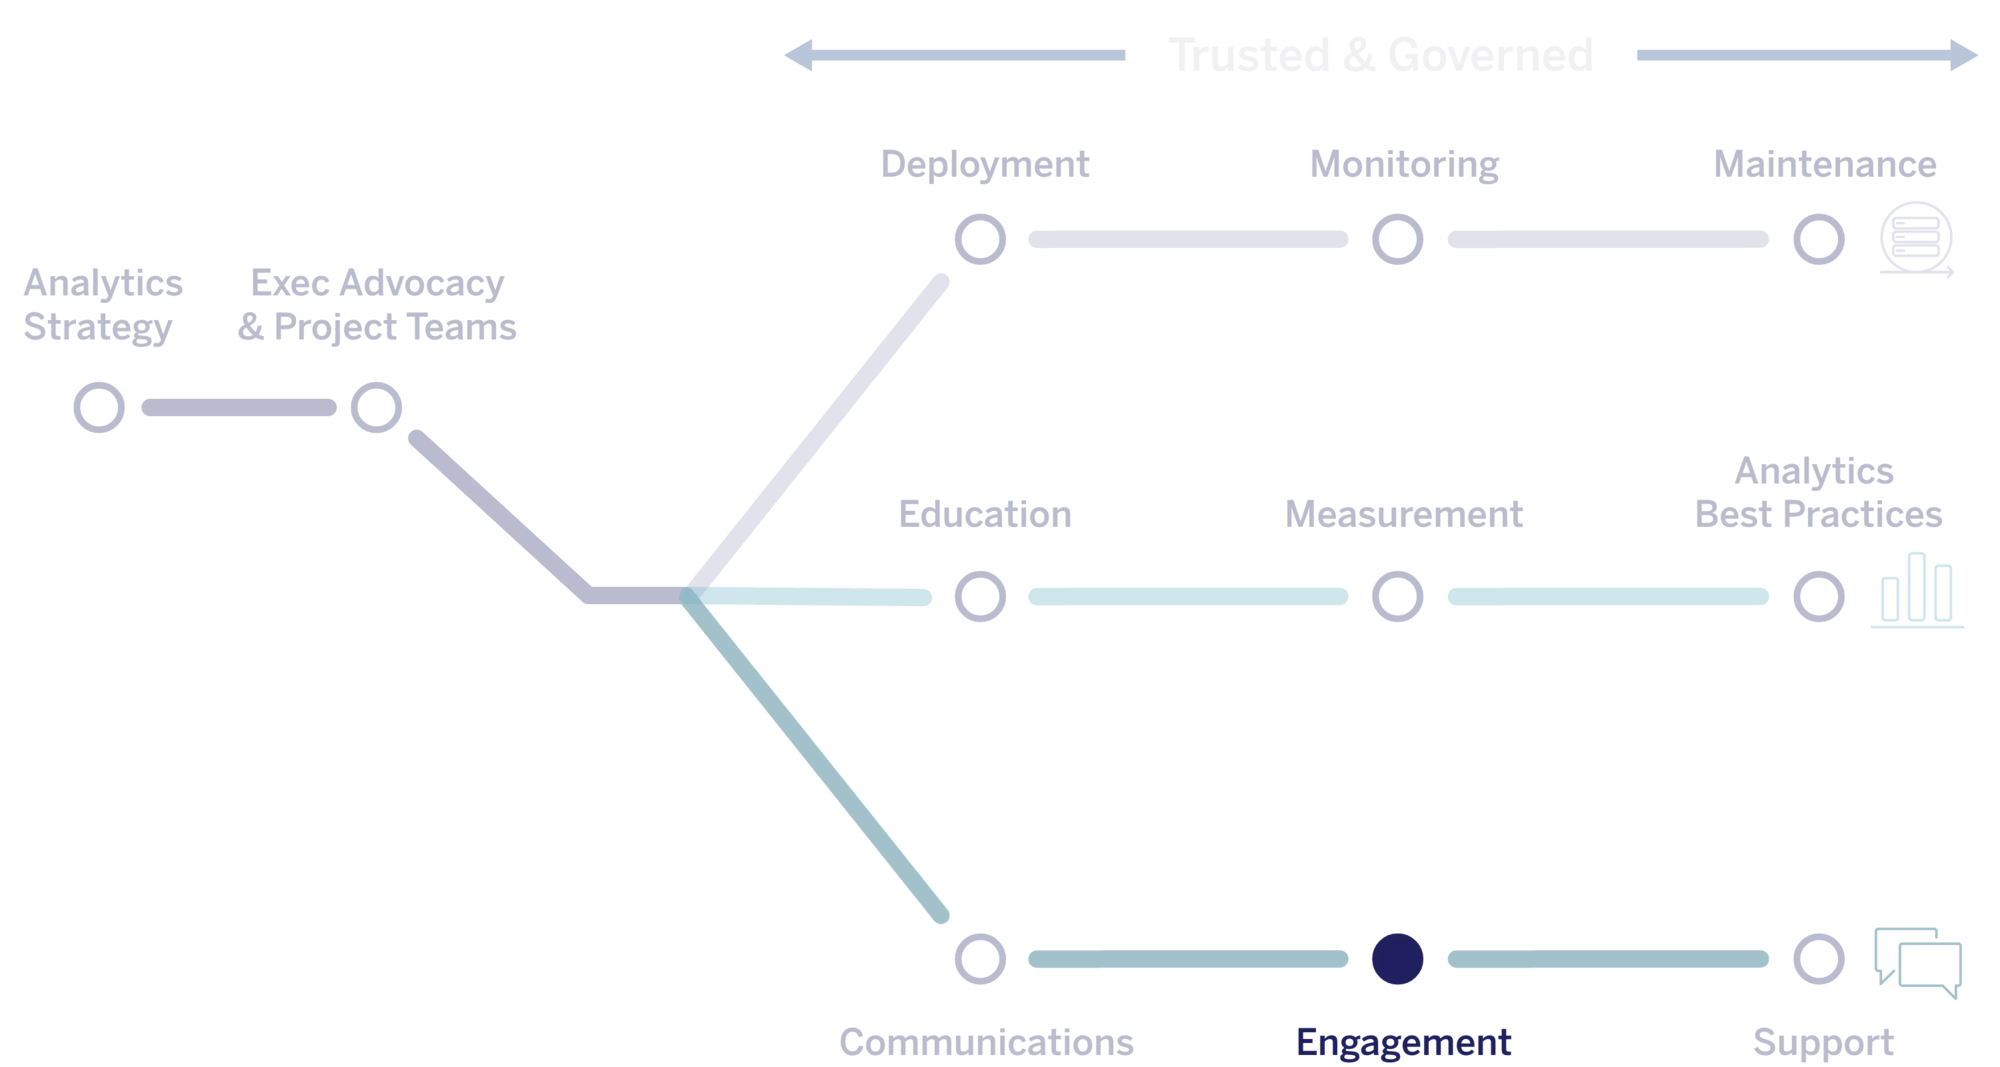
Engagement
You’ll create and nurture an environment for more productive, results-driven people to accelerate and reinforce the organization’s vision for modern analytics. You may organize a variety of activities to cultivate your thriving user community—from internal user group meetings, knowledge transfer sessions, and competitions to external community activities that plug into the larger, worldwide Tableau Community.
This topic covers:
- Internal activities — User Group, Champions Group, Admin Group, Lunch & Learn, Viz Games, Tableau Day, Analytics Day
- External activities — Area Tableau User Group, Virtual Tableau User Group, Tableau Public challenges, Tableau Community Forums, Tableau Conferences, Iron Viz Competition

Support
You’ll put the appropriate processes in place to efficiently support your user base, removing obstacles to using data and analytics effectively. This includes defining a support escalation path, supporting users with traditional helpdesk support requests and external resources, and connecting people with peer-to-peer assistance, like mentoring.
This topic covers:
- Tableau Champion development
- Peer-to-peer assistance
- External Tableau Community Forum

How to Build a Data Community Within Your Organization
Learn from the most successful and passionate data community—the Tableau Community—to inspire building your own internal network of engaged data users.
Read now
"The outcome of our internal user group has been to actually build a group of people who are working together, collaborating, sharing their skills and just sort of pushing each other forward."

"Instead of each developer having to learn new Tableau techniques, we can pitch new tips and tricks we’ve discovered in Tableau to other developers and bring up the knowledge in our organization as a whole."
Continue exploring Tableau Blueprint
discover the tableau blueprint methodology
build your analytics vision
define a governance model