DataFam Roundup: October 11 - October 15, 2021


Dig into the latest DataFam Roundup—a weekly blog that brings together community content all in one post. As always, we invite you to send us your content—and the DataFam content from your peers that have inspired you! Find the content submission form here.
DataFam content
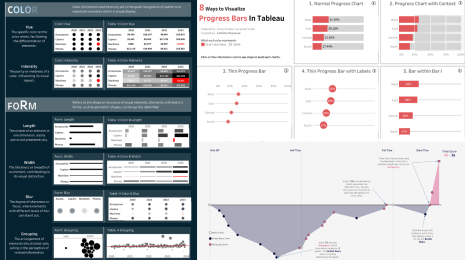
Bridget Cogley, Tableau Fit: 5 easy cheats to make stellar Tableau dashboards
Dive into content created by the Tableau Community:
- Tim Ngwena, Tableau Tim: 2021 Tableau Desktop Specialist Exam Guide: Tableau Certification
- Dawn Harrington, Tech Tips Girl: Just a Few Bar Tips for Dashboards
- Kevin Flerlage, The Flerlage Twins: Change Filters From "AND" to "OR"
- Keith Helfrich and Jonathan Drummey, Action Analytics: TSVP #5: Null Values vs Sparseness
- Priya Yogendra Rana, MakeoverMonday — A Sunset or a new Dawn?
- Branden Kornell: My #MakeoverMonday Confessions
- Dzifa Amexo and Dzifa (Maureen) Q., On the DL(L): MS Data Science Abroad, Comfort Zones, & Tiramisu
- Pahola Diaz, Dataxa: El éxito de las Fuentes de Datos publicadas en Tableau Server The Success of Data Sources published on Tableau Server (Spanish)
- Simon Beaumont, Sport Viz Sunday: Weekly Round-Up 10.10.2021
- Bridget Cogley, Tableau Fit: 5 easy cheats to make stellar Tableau dashboards
- Alice McKnight, Tessellation: Five Ways to Create a Well-Documented Tableau Dashboard
- Irene Diomi, The Information Lab: How to in Tableau in 5 mins: Make Zoomable Charts
- Agata Mężyńska, Combo Chart, czy to Dual Axis? Combo Chart or Duel Axis (Polish)
- David Arboledas with dashboard by Ana Milana, Quadriciclos.es: Combustibles más usados en España (Tableau Dashboard) Most used fuels in Spain (Spanish)
- Sarah Bartlett, Sarah Loves Data: Iron Quest Travel & Vacations – Recap
Upcoming events and community participation

Tableau Conference Register Today!
-
Join the list to receive the very first edition of Data Digest, our new Tableau Community newsletter. Data Digest will be filled with the latest and greatest news, upcoming events and other opportunities to keep you informed, inspired and connected with the global #DataFam
- Tableau Conference: Join Tableau and the world's largest data community online for three days of learning, connection, and inspiration. Register Today!
- Iron Viz, the world’s largest virtual data visualization competition—ignites and showcases the power of the Tableau Community, giving you the opportunity to interact with data rockstars worldwide. Three finalists will advance to the 2021 Iron Viz Championship this November at Tableau Conference.
- The 2021 Vizzies Award Nominations The Tableau World Podcast loves to recognize the awesomeness of the Tableau community, beyond those who have been recognized by Tableau as Zen Masters (including the HOF TZM). So without further ado, we present the 7th Annual Vizzies. Nominations are open through October 31st.
- Tableau's Pre-Release and User Research Community Welcome to our new Pre-Release and User Research Community! This new website enables us to make early software and other feedback opportunities more accessible to you and in turn makes it easier for you to provide input to us. Enjoy!
- A Cup of Data vol 4, UX Workshop, November 12th, 10 AM CT - 11.00 AM CT Join us for the fourth session of our Cup of Data series where we expand on your Tableau CRM skills. Yet again we are changing up the format and making this session different. This time we’re joined by User Experience Principal, Elena Migunova, for a UX Workshop.
Vizzes
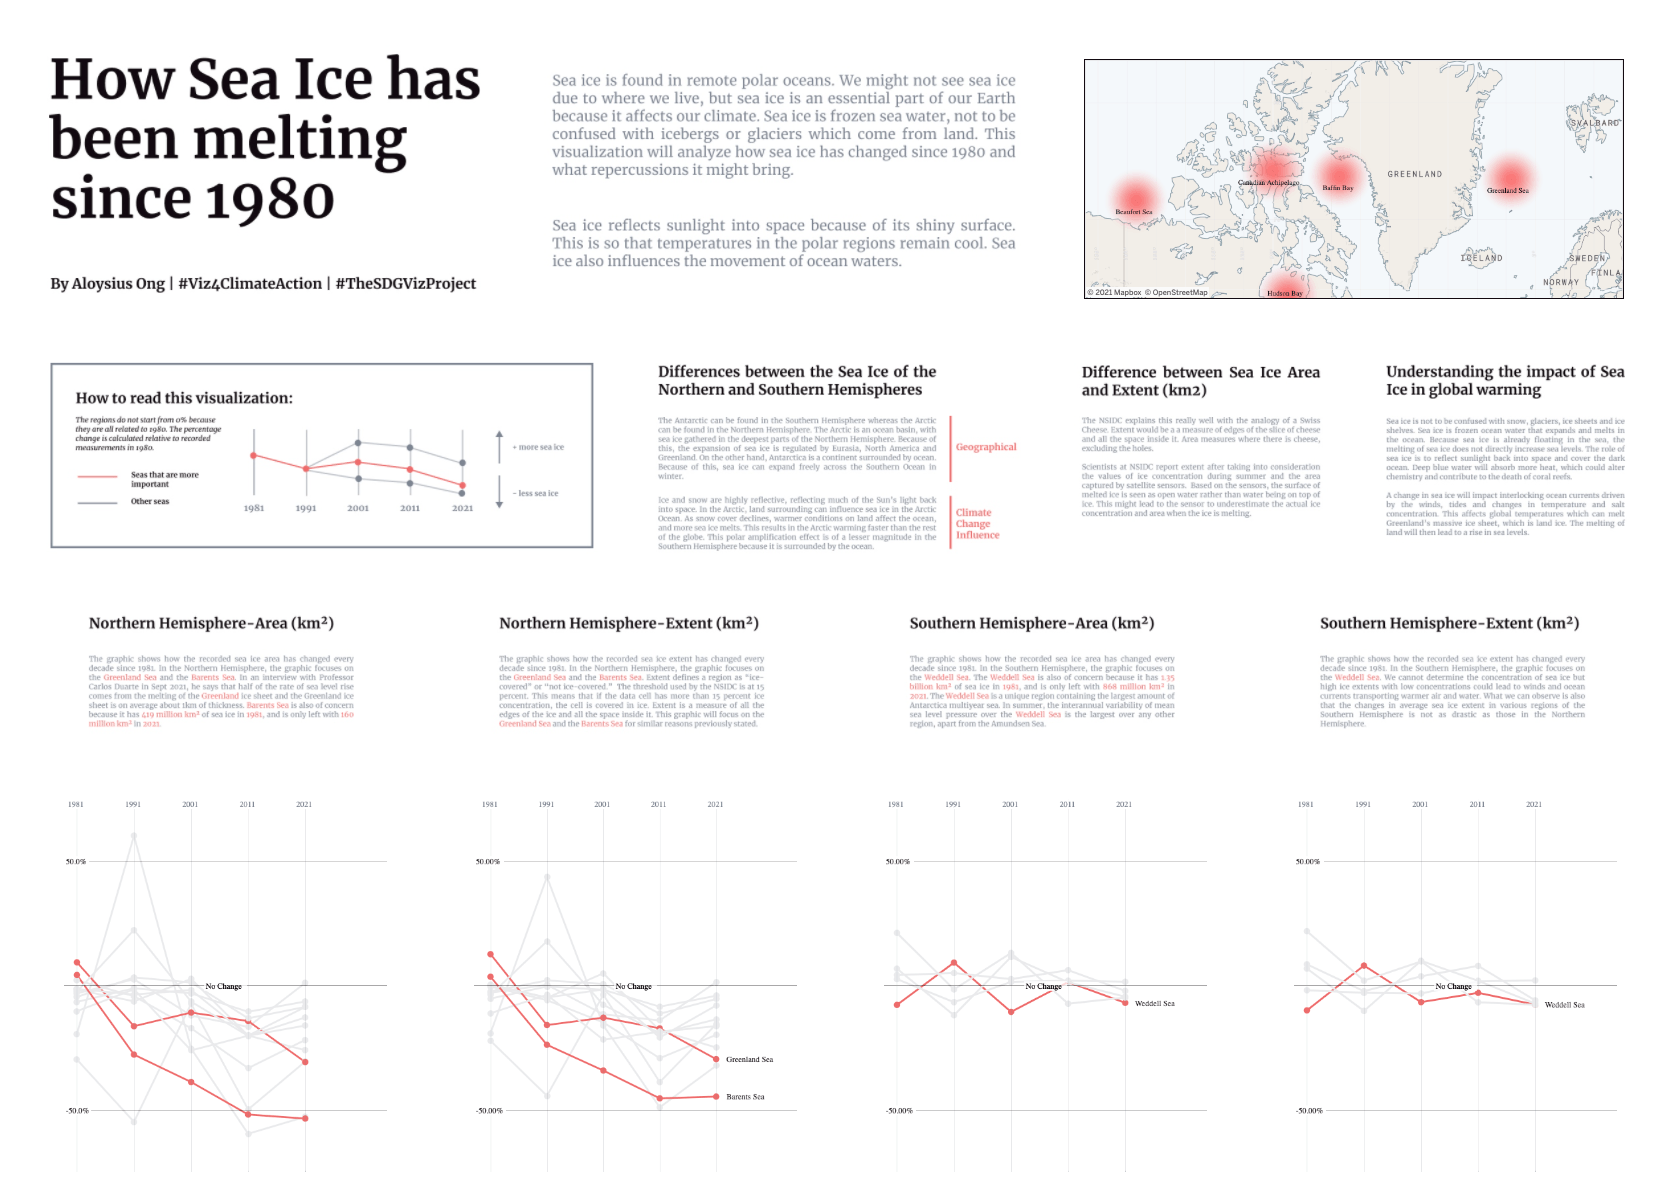
Aloysius Ong: How Sea Ice has been melting since 1980 | #Viz4ClimateAction | #TheSDGVizProject
Catch this week’s Viz of the Days here and subscribe to get them emailed directly to your inbox.
Check out some inspirational vizzes created by the community:
-
Naresh Suglani: Lewis Hamilton | 100 Grand Prix Wins
-
Saverio Rocchetti: UK Pay Gender Gap
-
Aloysius Ong: How Sea Ice has been melting since 1980 | #Viz4ClimateAction | #TheSDGVizProject
-
Aakarsh R: Roger Federer
-
Bo McCready: Treehouse of Horror: 100 Simpsons Halloween Stories
-
Luke Abraham: Fertility Rates - The Decline - 1960-2019
Community Projects

Workout Wednesday
Build your skills with a weekly challenge to re-create an interactive data visualization.
Web: Workout Wednesday
Twitter: #WOW2021
Week 41: How Much Do Top Sub-Categories Contribute to Sales?
Sports Viz Sunday
Create and share data visualizations using rich, sports-themed data sets in a monthly challenge.
Web: Sports Viz Sunday
Twitter: #SportsVizSunday
September 2021: Sporting Heroes & Legends
Iron Quest
Practice data sourcing, preparation, and visualization skills in a themed monthly challenge.
Web: Iron Quest
Twitter: #IronQuest
September 2021: Sporting Heroes & Legends
Storytelling with Data
Practice data visualization and storytelling skills by participating in monthly challenges and exercises.
Web: Storytelling with Data
Twitter: #SWDChallenge
October 2021: makeover challenge
Project Health Viz
Uncover new stories by visualizing healthcare data sets provided each month.
Web: Project Health Viz
Twitter: #ProjectHealthViz
September 2021: Biggest Healthcare Data Breaches
SDG Viz Project
Visualize data about Sustainable Development Goals provided by the World Health Organization.
Web: SDG Viz Project
Twitter: #TheSDGVizProject
COP26 UN Climate Change Conference: #VIZ4CLIMATEACTION
Preppin' Data
A weekly challenge to help you learn to prepare data and use Tableau Prep.
Web: Preppin’ Data
Twitter: #PreppinData
Week 41: Southend Stats
Real World Fake Data
Create business dashboards using provided data sets for various industries and departments.
Web: Real World Fake Data
Twitter: #RWFD
Dataset #12: Hospitality
Viz 2 Educate
Each month, create vizzes on global education syllabus topics as resources for teachers worldwide.
Web: Viz 2 Educate
Twitter: #Viz2educate
Topic: Microbiology
Diversity in Data
An initiative centered around diversity, equity & awareness by visualizing provided datasets each month.
Web: Diversity in Data
Twitter: #DiversityinData
Viz for Social Good
Volunteer to design data visualizations that help nonprofits harness the power of data for social change.
Web: Viz for Social Good
Twitter: #VizforSocialGood
Makeover Monday
Join the community every Monday to work with a given data set and create better, more effective visualizations.
Web: Makeover Monday
Twitter: #MakeoverMonday
Histórias relacionadas
DataFam Roundup: April 8–12, 2024
 12 Abril, 2024
DataFam Roundup: April 1–5, 2024
5 Abril, 2024
DataFam Roundup: March 25–29, 2024
29 Março, 2024
Subscribe to our blog
Receba em sua caixa de entrada as atualizações mais recentes do Tableau.