Chimdi Nwosu: DataFam notable newbie to visualization rockstar


Designing minimalistic visualizations is Tableau Public Ambassador Chimdi Nwosu's specialty. His designing approach has led him to three Viz of the Day nominations, recognized as a 2020 Tableau Public Featured Author, a top ten Iron Viz 2021 finalist, and four 2021 Vizzie awards. He's no stranger to the DataFam—even though he made his debut into the Tableau Community a little over a year ago.
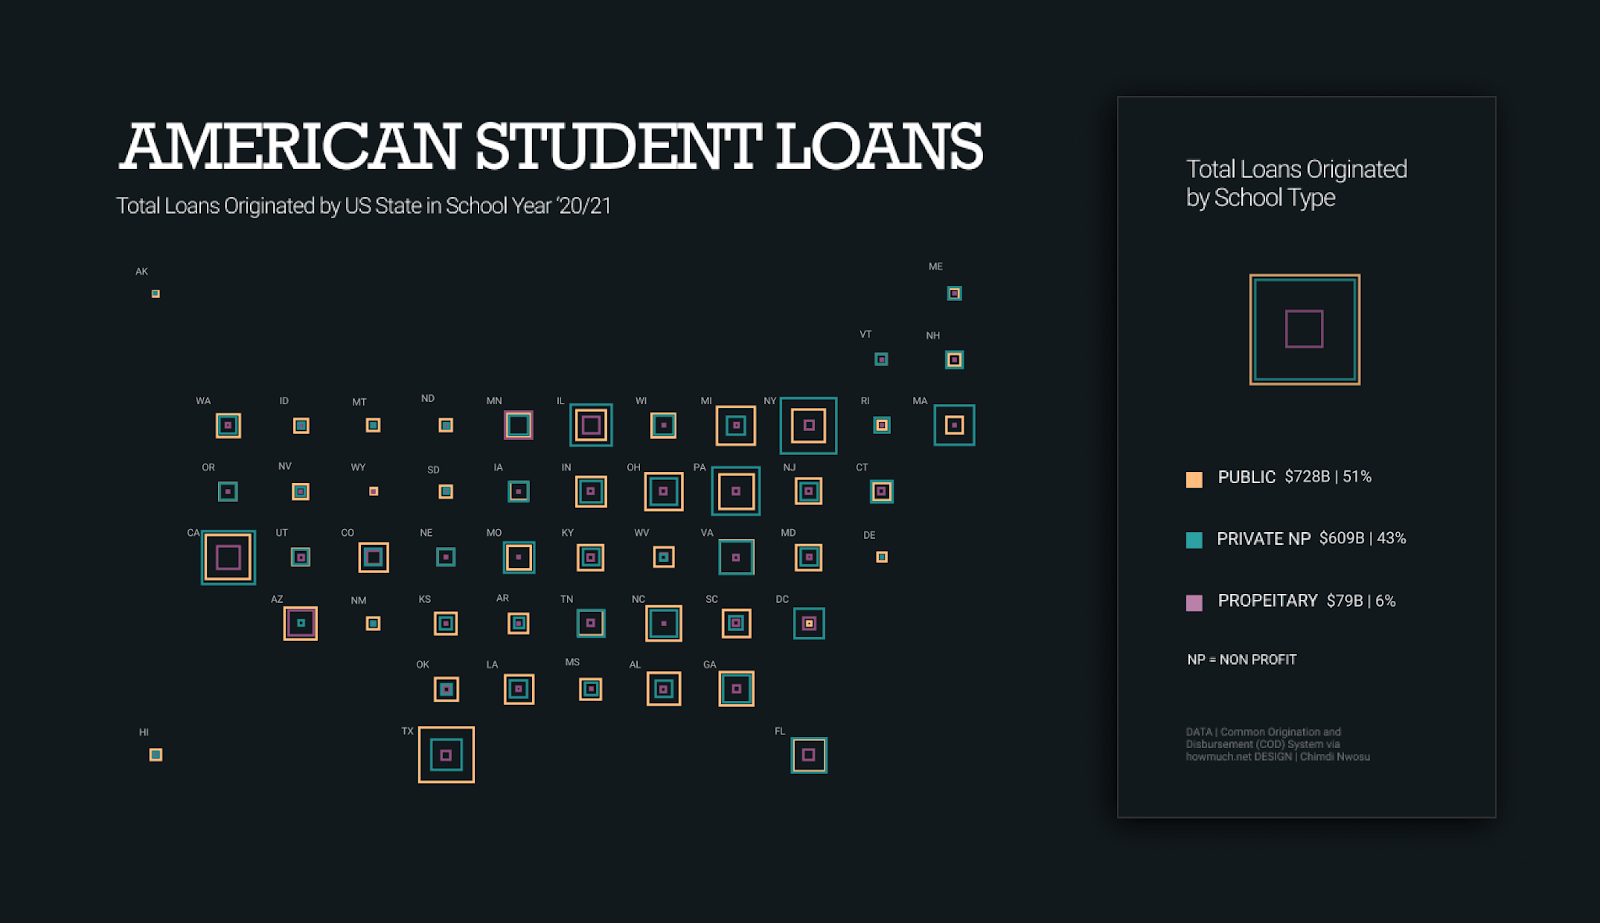
Most recently, Chimdi was a community speaker at Tableau Conference 2021, where he did a live build of his US Student Debt visualization, highlighting how you don't always need a lot of charts and dashboard components to tell an impactful story. The basic concept behind designing a more minimal dashboard is to design for quick comprehension. To successfully use this concept, you should keep the following principles in mind:
- Focus on communication
- Remove distractions - “Less is more”
- Each component should serve a purpose
- Highlight the center of attention, design around it
- Leverage “negative space” effectively
- Use color to enhance information
Throughout the episode, Chimdi shared design tools, techniques, and visual components behind the viz—ultimately leading to clearer insights and a bigger impact. You can watch the full TC21 episode, “Minimalist Designs for Maximum Communication” on-demand for free here.
We sat down with Chimdi to hear more about his experience speaking at TC21 and his Tableau learning journey.
Can you share a bit about your Tableau journey? How long have you been using Tableau?
Chimdi Nwosu: I got into Tableau in early 2020 during Covid as a way to keep productive during lockdown. Tableau had a 90 day Tableau eLearning promo which I used to learn the foundational concepts, and the rest as they say, is history.
Around August, I began taking part in #MakeoverMonday, and this was probably the best decision I've made on this journey. Having Zen Masters Andy Kriebel, Eva Murray and other guests host sessions dedicated to reviewing different vizzes showed that though we all have our different styles, there are common concepts to be applied in the pursuit of an effective data viz.
It's been more than a year now and a lot has happened since then. From being chosen as a Tableau Public Featured Author in 2020 and now serving as a Tableau Public Ambassador in 2021, it's been an extremely fast progression for me. Overall I've been using Tableau for more than a year and a half and it's difficult to picture a time when I’ll not be using it. There have been more opportunities to speak of my journey and share tips that I've learned with the community, so things are still evolving. Currently, we use Tableau daily at work and it is very fulfilling.
Tell us more about your experience speaking at TC21. What about your topic resonated with you so much that you wanted to present it? How was the overall process and feedback from community members afterwards?
Chimdi Nwosu: I wanted to talk about it because it was a weak point that seemed to stand out in otherwise great data visualizations encountered at work and in the community. Storytelling isn't intuitive to most of us, so we often end up with a mish-mash of analysis from taking the approach of showing whatever we find in the data. However, the data visualizations with the most impact generally have a focused story. Being able to highlight and share the concept of a minimalistic visualization is something I felt would benefit many who want to tell stories to provide insight or solicit action.
It would be hard to cover this concept without some form of demonstration. Covering it by highlighting an example viz was almost a given, and I'm grateful for everyone at Tableau who helped develop the recorded session and slides.
The feedback from the community was encouraging, and I eventually lost count of all the messages from people sharing how the talk resonated with them. I think this confirms the value of knowing this method of communicating with data, and it's great to imagine that so many will be able to implement it at work and in personal projects.
Any favorite TC21 sessions or TC21 experiences that come to mind? Anything you're looking forward to in next year's TC?
Chimdi Nwosu: I loved the speed tips by Heidi Kalbe, Lorna Brown, and Ann Jackson (view on-demand here). I'm probably a bit biased because it was streaming while at work, and helped out with something being worked on at that moment. Priya Padham's session highlighting the community side of Tableau was also fantastic (view on-demand here).
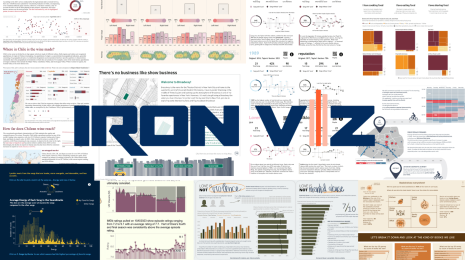
Iron Viz probably gave the most thrill; everyone did awesomely, and this is one that I probably anticipate the most every single year. I'm partial to anything that involves hands-on vizzing!
Why are you so passionate about designing minimally? How has this impacted you professionally?
Chimdi Nwosu: When adopting the minimalist style, it helps viewers focus on what they need to see and understand, without needing to strain and work hard to find the goods. Professionally, the users who interact with my work are usually in management or executive level positions, so their time and attention is valuable. Knowing how to keep things minimal by showing focused insights using these concepts, ensures that they aren't wasting precious time trying to understand what the data is trying to tell them. It's really cool showing a chart, and watching them put it all together as they examine the data and make the relevant connections to some of the experiences they've had in their roles which often have nothing to do with data per se.
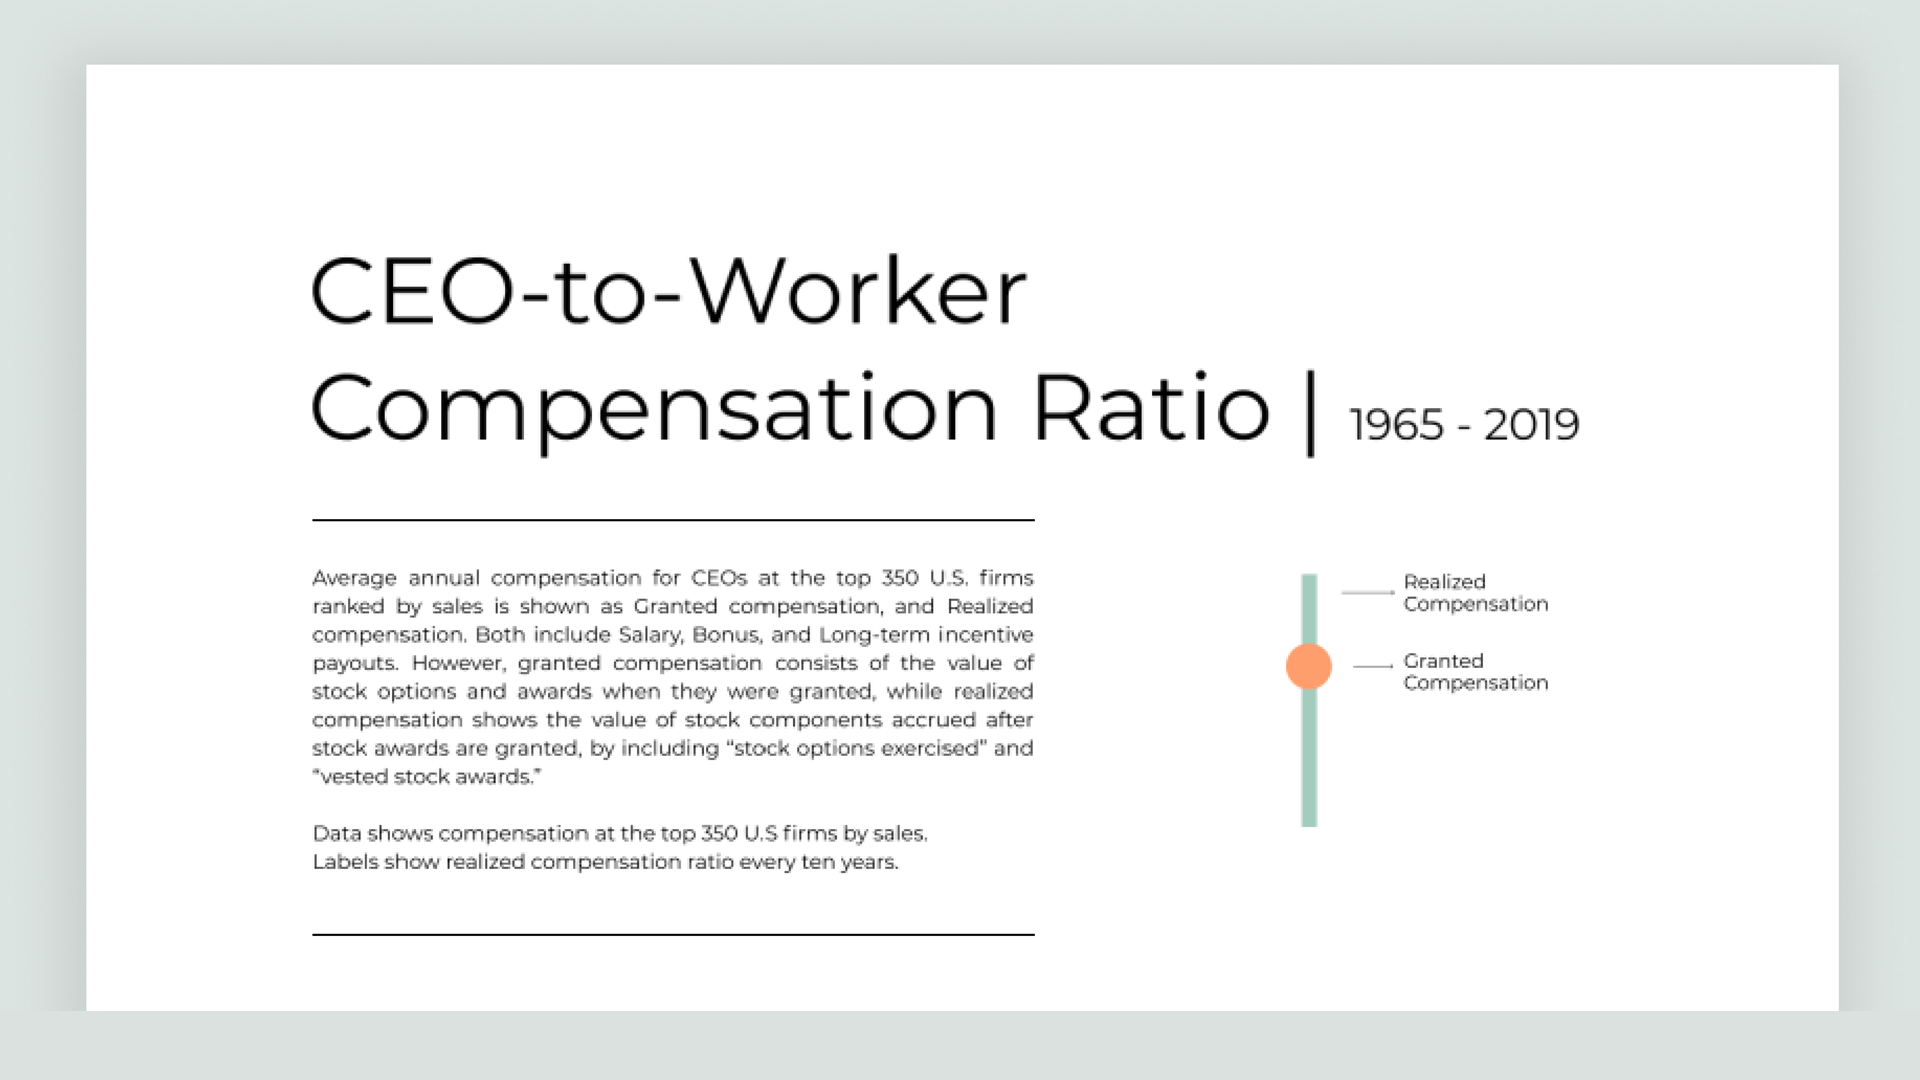
Some visualizations that come to mind that really encapsulates the minimalist style is “My 100th Viz” by Kevin Flerlage, “Berkeley courses” by Judit Bekker, and my #MakeoverMonday viz “CEO-to-Worker Compensation Ratio | 1965 - 2019.” There are certainly times where we'll need to expand a bit more and in general, but these really show how less is often more.
Knowing how to keep things minimal by showing focused insights using these concepts, ensures that they aren't wasting precious time trying to understand what the data is trying to tell them.
Do you have any advice for new folks getting started with Tableau?
Chimdi Nwosu: If you're not part of the #DataFam, I'd recommend finding a way to participate and immerse yourself in one form or another. There is VizConnect where different community members get invited to speak on various topics related to data viz. There are also others to check out on Twitter: #DiversityinData, #SportsVizSunday, #IronQuest, #WorkoutWednesday, #buddytalk, and a new one #B2VB (Back 2 Viz Basics). The first four are viz focused and indulge our creativity while highlighting issues across different areas. #buddytalk provides tips on breaking into the industry, and the final one strengthens our understanding of the basics of data viz.
I’d also encourage you to share your work and progress as you go along. Personally, I found that vizzing consistently at the beginning had the greatest impact. Consider finding a way to do this if it's feasible for you. Over time, you'll improve a lot and gain confidence in your skills while meeting great people along the way.
You recently won four different TC21 Vizzie awards that were nominated by members of the Tableau Community. Can you share how the community has impacted your data visualization journey?
Chimdi Nwosu: Joining the Tableau Community sped up the pace at which I was able to improve my skill set. Something with a major impact is/was the many available community events that provided a platform for consistent vizzing. This was really helpful in keeping a relatively high frequency with my delivery, and in my experience, this made the biggest difference in the quality of my output over time. Feedback from talented, and often experienced DataFam folk has always been helpful in steering me in the right direction, and this also encouraged me to keep trying out new things and improving upon my skill set.
There are sometimes a million doubts in my mind about many things but overall, the support and inspiration in and within the community has challenged me to keep putting myself and my work out there in ways which will likely not have happened without this community. At this point it's almost cliche to say but the DataFam really is the best.
What's next for you? Do you have any plans or goals around Tableau and the community in the coming year(s)?
Chimdi Nwosu: What seems most natural is to expand more on the journey so far, and also digging deeper into some of my beliefs, ideas, convictions, and approaches related to data visualization. Since people have seen the data viz side, perhaps it's time to show what's beneath the covers of the work and the person behind it. It will be challenging to be more outspoken, but there is likely an opportunity to impact people even more and I welcome this opportunity. A blog, website, or something similar seems like the best way to accomplish this and I'll be assessing the best way to execute it.
Connect with Chimdi
Explore Chimdi's work on Tableau Public and find him on Twitter and LinkedIn. You can also experience and interact with Chimdi's viz, "Ethnicity As A Factor For COVID Death in the UK" in the TC21 Viz Gallery.
Relaterade berättelser
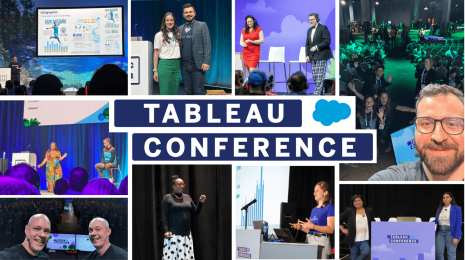
Tableau Conference ‘Call for Participation’: Tips for Submitting Your Session Proposal
3 tips to submitting a compelling Tableau Conference session proposal.
Top 10 Qualifiers for Iron Viz 2024
 17 Januari, 2024
What is Tableau’s Iron Viz?
 26 September, 2023
Subscribe to our blog
Få de senaste Tableau-uppdateringarna i din inbox.