DataFam Roundup: August 23 - 27, 2021


Dig into the latest DataFam Roundup—a weekly blog that brings together community content all in one post. As always, we invite you to send us your content—and the DataFam content from your peers that have inspired you! Find the content submission form here.
DataFam content
Will Jones, Interworks: 2021 Tableau Fantasy Football Draft Kit
Dive into content created by the Tableau Community:
- Tim Ngwena, Tableau Tim: What is the Lookup function in Tableau? Tableau Functions
- Donabel Santos, sqlbelle: 8 Data Sets for Your Tableau / Data / Analytics Projects
- Jim Dehner: 5 Ways to do YoY and YTD -
- Ken Flerlage, The Flerlage Twins: New Viz: The Law & Order Universe
- Matthew Bernath, The Financial Modelling Podcast: Data Analytics Books Recommendations Part 2 - Becoming a Data Head
- Carni Klirs featuring Sean Peoples and Tiziana Alocci, Nightingale: Data-Driven Album Covers, Nightingale
- Jared Flores, WhatTheViz: How does the Aggregate Step work?: Put some Prep in your Step
- Eric Parker, OneNumber: How To Unpivot (Transpose) in Tableau Prep - Using the New Rank Feature
- Rahul Lalwani, The Data School: 5 things to do before creating your dashboard in Tableau
- Will Jones, Interworks: 2021 Tableau Fantasy Football Draft Kit
- Prasann Prem: Tableau Buddy Journey So far...
- Alexander Mou, Vizible Difference: Creating Sunburst Chart with Labels Inside and Categorical Sequential Colors in Tableau
- 白紙: DATA Saberの旅路 第2週目 【ユーザー会のイベントに参加しよう】DATA Saber's Journey Week 2 [Let's Participate in User Group Events] (Japanese)
Upcoming events and community participation
- Tableau Buddy is a firsthand beginner's den for those who are really serious about making a career in Data visualization specifically using Tableau. Connect with Tableau APJ Speaker Bureau Member Prasann Prem and book a session.
- September 17th, 10 AM CT – 11.00 AM CT: Join the third session of the Cup of Data series to expand on your Tableau CRM skills. The product team will demo their latest and greatest in a 'Release Jam'. Register for the event.
- Come Join Team #SportsVizSunday! If you are someone that loves sports, loves data, and loves the chance to selflessly showcase others then we invite you to put your name forward! Learn more.
Vizzes
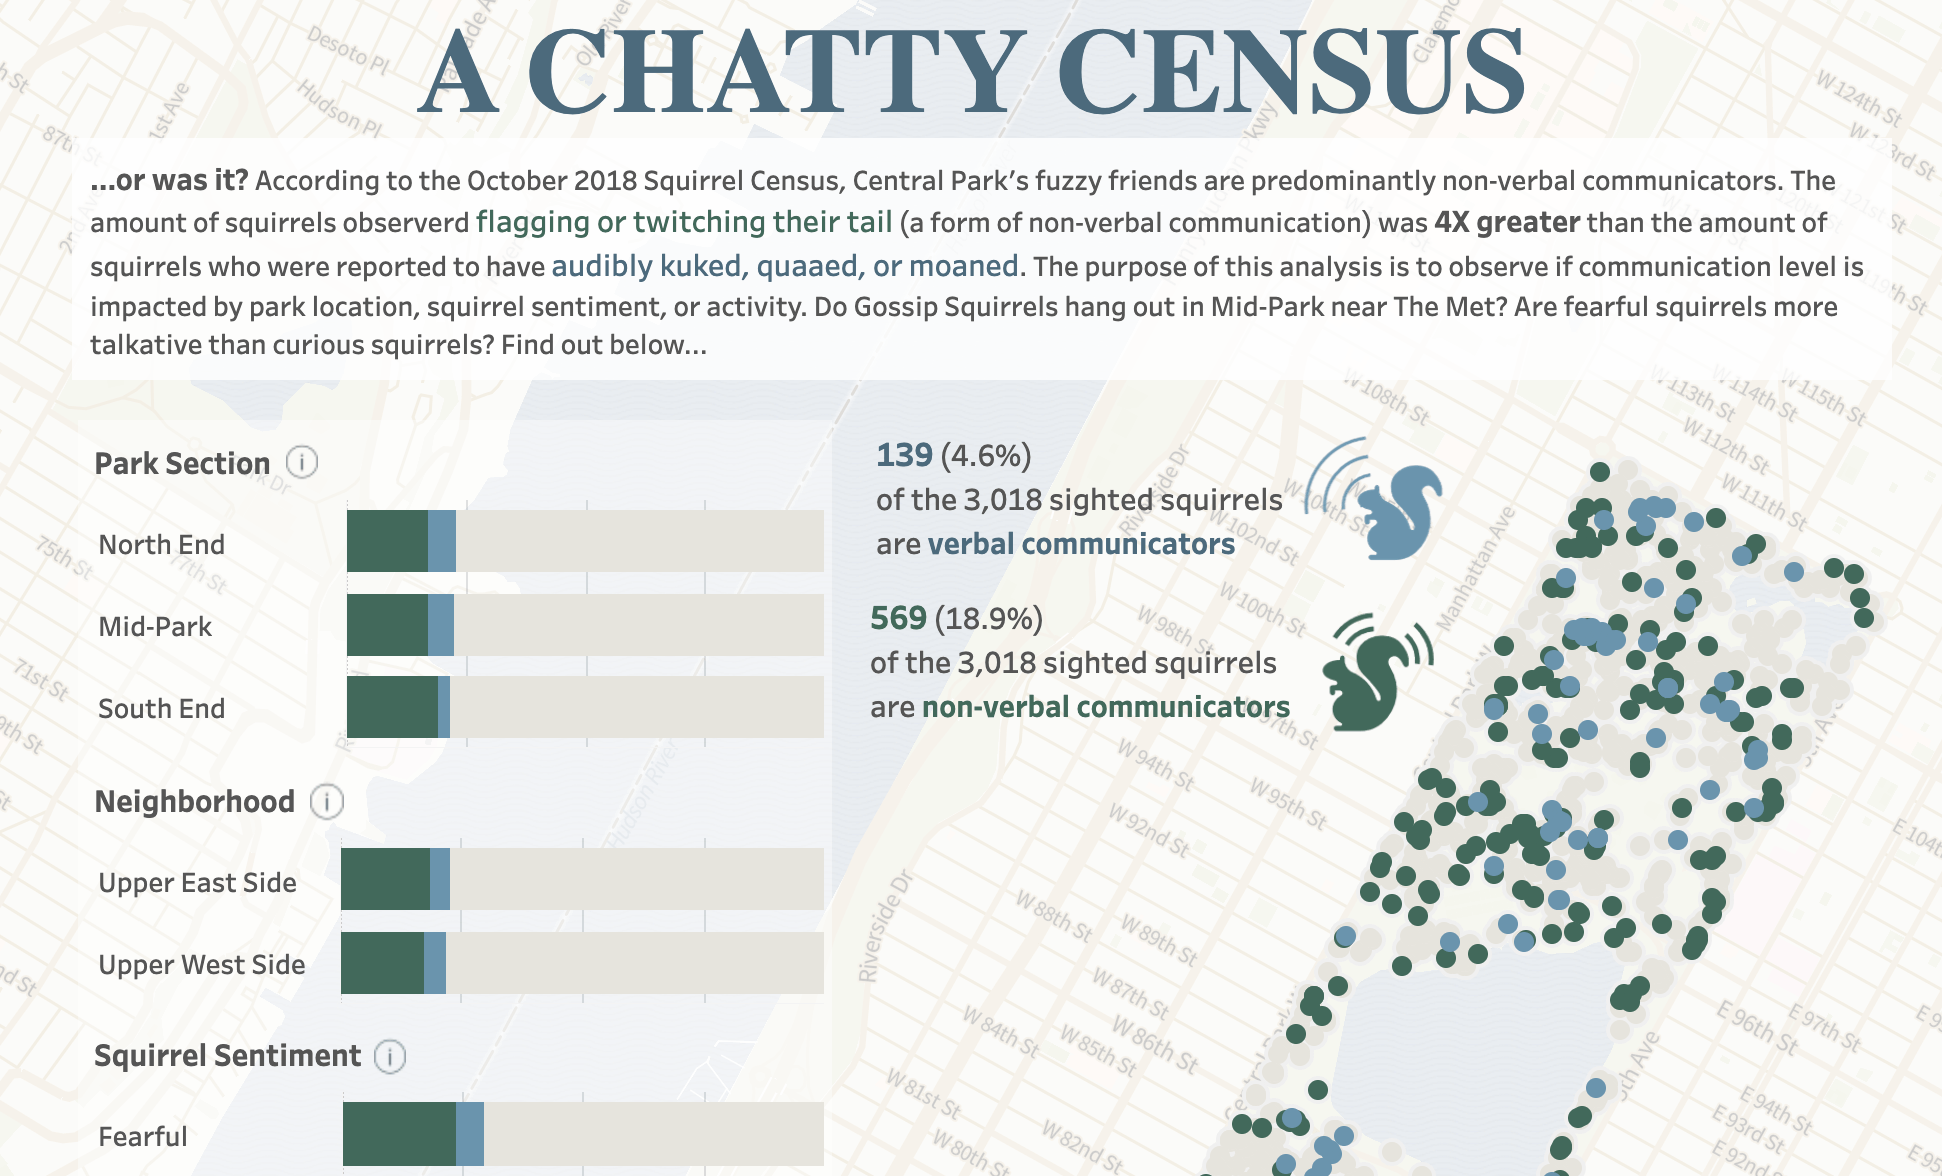
Emily Gilmore: A (not so) Chatty Squirrel Census
Catch this week’s Viz of the Days here and subscribe to get them emailed directly to your inbox.
Check out some inspirational vizzes created by the community:
-
Emily Gilmore: A (not so) Chatty Squirrel Census
-
Saverio Rocchetti: Refugees
Community Projects

Makeover Monday
Join the community every Monday to work with a given data set and create better, more effective visualizations.
Web: Makeover Monday
Twitter: #MakeoverMonday
Week 34: “Entry-level” jobs on LinkedIn require 3+ years of experience
Workout Wednesday
Build your skills with a weekly challenge to re-create an interactive data visualization.
Web: Workout Wednesday
Twitter: #WOW2021
Week 34: How Many Consecutive Starts?
Sports Viz Sunday
Create and share data visualizations using rich, sports-themed data sets in a monthly challenge.
Web: Sports Viz Sunday
Twitter: #SportsVizSunday
August 2021: UFC
Iron Quest
Practice data sourcing, preparation, and visualization skills in a themed monthly challenge.
Web: Iron Quest
Twitter: #IronQuest
August 2021: Travel & Vacations
Storytelling with Data
Practice data visualization and storytelling skills by participating in monthly challenges and exercises.
Web: Storytelling with Data
Twitter: #SWDChallenge
August 2021: dashboard stories
Project Health Viz
Uncover new stories by visualizing healthcare data sets provided each month.
Web: Project Health Viz
Twitter: #ProjectHealthViz
SDG Viz Project
Visualize data about Sustainable Development Goals provided by the World Health Organization.
Web: SDG Viz Project
Twitter: #TheSDGVizProject
Goal 17: Partnerships for the Goals
Preppin' Data
A weekly challenge to help you learn to prepare data and use Tableau Prep.
Web: Preppin’ Data
Twitter: #PreppinData
Week 33: Excelling at adding one more row
Real World Fake Data
Create business dashboards using provided data sets for various industries and departments.
Web: Real World Fake Data
Twitter: #RWFD
Dataset #12: Hospitality
Viz 2 Educate
Each month, create vizzes on global education syllabus topics as resources for teachers worldwide.
Web: Viz 2 Educate
Twitter: #Viz2educate
Topic: Microbiology
Diversity in Data
An initiative centered around diversity, equity & awareness by visualizing provided datasets each month.
Web: Diversity in Data
Twitter: #DiversityinData
August 2021: Refugee Data
Viz for Social Good
Volunteer to design data visualizations that help nonprofits harness the power of data for social change.
Web: Viz for Social Good
Twitter: #VizforSocialGood
相关故事
DataFam Roundup: April 8–12, 2024
 2024/04/12
DataFam Roundup: April 1–5, 2024
2024/04/05
DataFam Roundup: March 25–29, 2024
2024/03/29
Subscribe to our blog
在您的收件箱中获取最新的 Tableau 更新。