Best practices for building effective dashboards


Whether you’re starting out on your analytics journey or powering through a long queue of reporting requests, you want every dashboard you create to reveal insights, improve outcomes, and be used by your stakeholders. So how do you build effective dashboards for your organization? Effective dashboards have clearly-defined metrics or KPIs, deliver the most relevant information to your audience, and support smarter, data-driven decisions.
It really comes down to three things: thoughtful planning, informed design, and a critical eye for refining your dashboard. In the "10 Best Practices for Building Effective Dashboards” whitepaper, you’ll discover guidance around these three focus areas with supporting use cases and examples. Check out a preview of some dashboard best practices to make the best visualizations for your audience and drive better business decisions:
1. Know your audience
The best dashboards are built with their intended audience in mind. Ask yourself, “Who am I designing this for?” and continue to check that what you’re building supports their business goals and encourages exploration.

2. Consider display size
Where will your audience be viewing the dashboard the most? Desktop or mobile? Do some research upfront to inform your design and adjust accordingly for the best experience.

3. Plan for fast load times
Who likes to wait? No one. That includes waiting for your dashboard to load. Make sure to optimize your dashboard for faster load times, which can contribute to better engagement.

4. Leverage the sweet spot
Most people scan web content starting at the top left of a web page. Be sure to place your most important view in that area to quickly get your point across and surface relevant data points.

5. Limit the number of views and colors
If you add too much to your dashboard, you’ll sacrifice the big picture. In general, limit your dashboard to two or three views. Also, consider using color only if it enhances the analysis. Sometimes too many colors can slow or even prevent analysis.

Want all of the tips and best practices for designing the most effective dashboards for your audience? Read the full whitepaper, "10 Best Practices for Building Effective Dashboards.”
For more dashboarding best practices, check out our “Do’s and don’ts when building dashboards" blog to take your visualizations to the next level.
相關文章
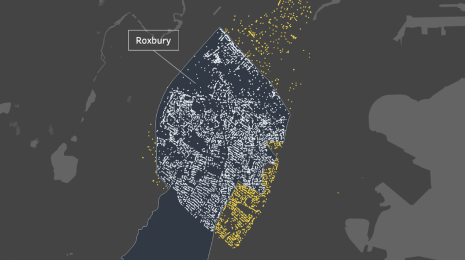
How to Use the Intersects() Calculation in Tableau
 2023/03/27
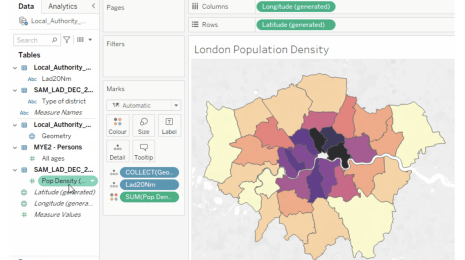
A Guide to Mapping and Geographical Analysis in Tableau
 2022/10/25

5 tips for mobile-first dashboard design in Tableau
 2019/12/03
Tableau Visionary Ryan Sleeper shares his tips for creating mobile-first dashboards in Tableau, including how to: determine if you should consider a mobile-first design, scroll multiple sheets at once and eliminate default scroll bars completely, leverage tooltips, and more.
Subscribe to our blog
在收件匣中收到最新的 Tableau 消息。