DataFam Roundup: December 4–8, 2023


Welcome! Dig into this week's DataFam Roundup—a weekly blog that brings together community content all in one post. As always, we invite you to send us your content—and the DataFam content from your peers that have inspired you! Find the content submission form here.
Community Highlight
To recognize new and consistent Tableau contributors—we’re excited to have a section within the weekly DataFam Roundup called the Tableau Community Highlight. Find out how to get involved.

Victor Muñoz, Aspiring Information Designer
Colombia
Victor Muñoz is an aspiring information designer. His journey with Tableau began this year when, after leaving his job in Colombia as an information security analyst, he traveled to Mexico and was introduced to data visualization and information design. Then after reading the book 'Storytelling with Data' by Cole Nussbaumer, Victor decided to explore Tableau for completing data visualization projects. Victor is now involved in the DataFam in a variety of ways including running a blog and participating in Community Projects and the Communidatos Tableau User Group.
Being self-taught, Victor began his own blog to give others a look into his process when creating vizzes and to inspire their own work. Victor first joined the DataFam through virtual and in-person connections and now hopes to be a resource to others just starting out in the community.
In addition to his blog, Victor also gives back with his involvement in the Communidatos Tableau User Group. Victor joined as an attendee but has now also presented at meetups. Victor finds the opportunity to share his knowledge with local peers and contribute to strengthening the Latinx data community’s presence rewarding.
Connect with Victor on Linkedin, X, Tableau Public, and on his blog.
DataFam content
Dive into content created by the Tableau Community:
-
Marc Reid, datavis blog: Embed Tableau Dashboards in Salesforce
-
Ludovic Tavernier: How to explore Tableau Server Connections with Python
-
Ayodeji Omokehinde: Venturing Into Data Mastery: Unveiling a Tale of Rediscovery and Crafting a Dynamic Project
-
Donabel Santos, sqlbelle: Master Tableau's Order of Operations - Beginner's Guide - Comprehensive Tutorial with examples
-
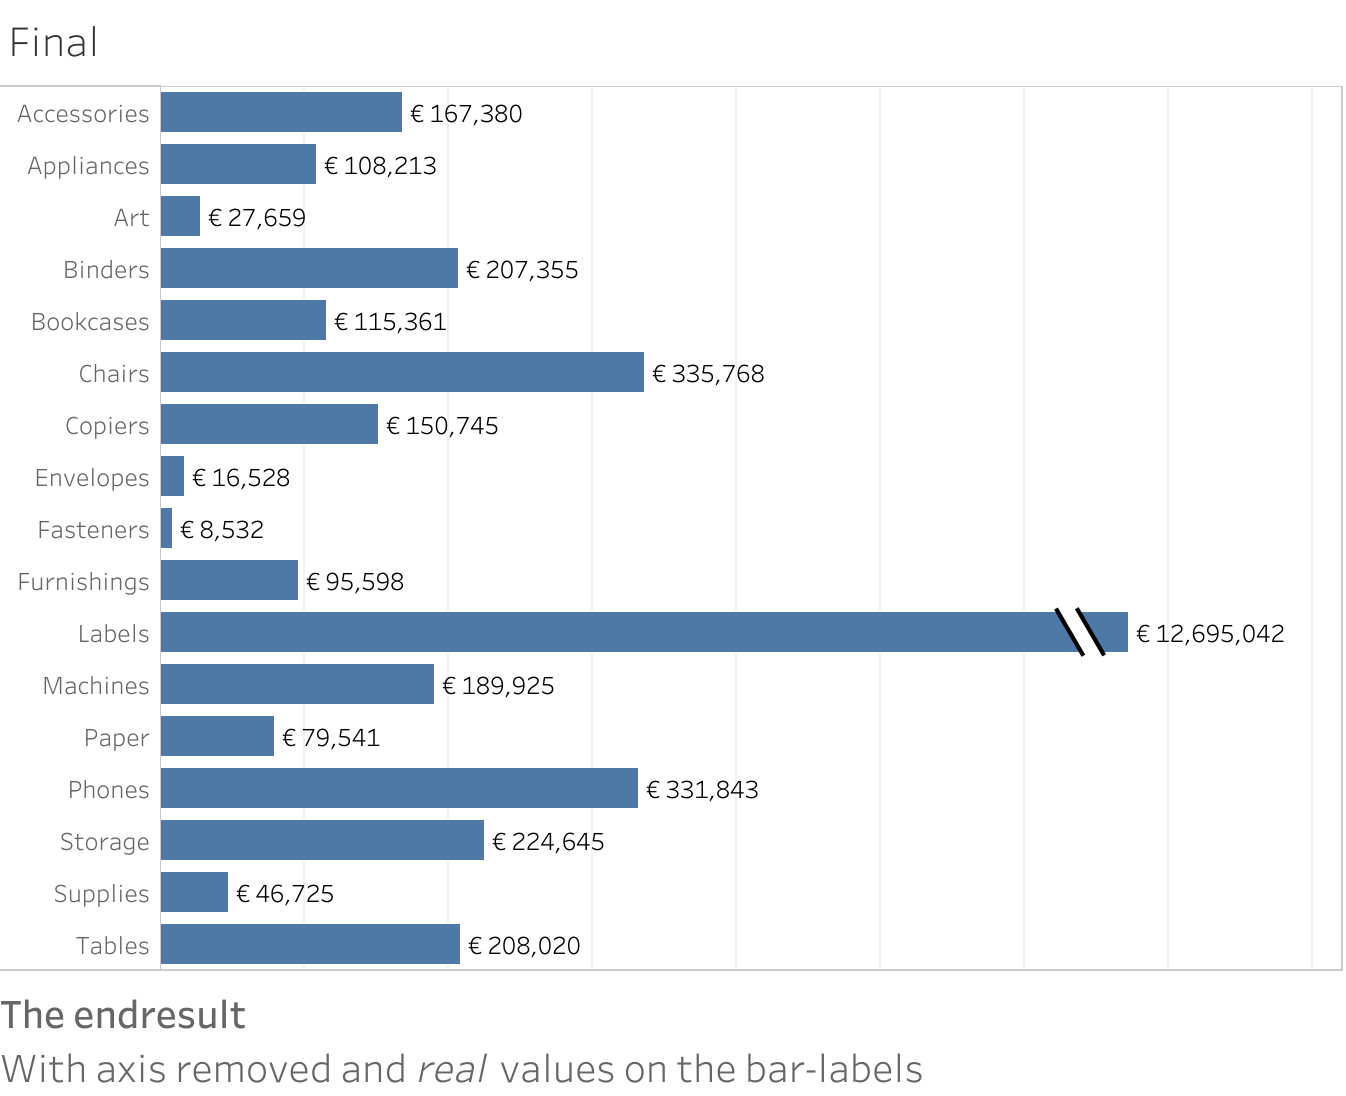
Johan de Groot: How to visualize extreme values?
-
Catherine Li, Data Leadership Collaborative: 5 Strategies to Close Your Data Team’s AI Skills Gap
-
Chart Chat Live: Charts in the Movies
-
Muskan Kashyap: Unveiling the Wizarding World of Harry Potter Through Data!
-
Eric Parker: Bar Chart/Highlight table trick in Tableau
-
Jim Dehner: Beyond Getting Started 7 - Filters
-
Dawn Harrington, Tech Tips Girl: How to Make Rounded Corners
Team Tableau
- Introducing Enhanced Stats on Tableau Public! Uncover hidden trends, track engagement, discover who you’re inspiring, and make your profile shine. Log in to view your stats: tabsoft.co/3SGRJ67
- Explore the 2024 Iron Viz Entries
- New vizzes and favorites are available on the Recent Activity channel in Tableau Public.
- 7 Ways to Stand Out and Secure Your Next Data Analytics Role
- Transforming Ideas into Features: Tableau's Commitment to Community-Driven Innovation
Upcoming events and community participation
-
Apply or Nominate to Become a 2024 Tableau Visionary by 11:59 PM (PT), Thursday, January 11, 2024.
-
Fundamentals of Data Visualization: Friday, December 15, Get ready to level up your data visualization skills with Tableau.
-
#TableauNext 2024 Nominations: Nominate individuals who have significantly impacted the DataFam through their work with Tableau or Salesforce, but are not yet recognized as Visionaries, employees, or Ambassadors. Nominations close at 11:59 PM (ET) on December 29th.
-
Lights, Camera, Action: Tableau and IMDb Launch Data Visualization Campaign for Movie Lovers
-
2024 Iron Viz Qualifiers: Top 10 Results January 17, 2024, 9:00 AM (PT) Virtual Event - Find out the top 10 Tableau Public visualizations, including the 3 finalists selected to compete in the 2024 Iron Viz Championship.
-
READY TO SUPERCHARGE YOUR DATA SKILLS? The Information Lab has free, on demand training courses will help you to make sense of your data and take you from zero to data hero. Developed by our industry leading trainers, our expansive courses cover the basics to intermediate levels of Tableau, Alteryx and Tableau Prep! You can take advantage of the whole course or simply choose the modules you need to brush up on your skills. Start your data journey today by simply selecting your training course below.
-
Demystifying the way to learn Data Visualization! Are you looking for a way to learn Data Visualization and feeling lost? We all have been there and I am going to help you understand the fundamentals and look for a way to learn data visualization.
-
Viz Collab: Hello everyone! I’m excited to be opening #VizCollab back up for another round of matches! In the last year I matched around 40 people for some amazing vizzes, including Viz of the Days and a viz that was featured in a local publication. So if you want to find a collaboration partner sign up.
Vizzes
Jeff Plattner: My 2023 Peloton Fitness Tracker
See the latest Viz of the Day, trending vizzes, featured authors, and more on Tableau Public.
Check out some inspirational vizzes created by the community:
-
Autumn Battani: Highlighting Multiple Dimensions Pt. 1
-
Rob Taylor: Tableau Advent Calendar 2023
-
Adrian Zinovei: Dashboard Builder
-
P A T H | We Are Data People: Dinheiro vivo no mundo atual
-
David Rudkin: Messi at Barça 2004-08
-
Tanya Lomskaya: Superstore Performance Dashboard
-
Linda Duong
-
Whitney Wood: Cotton Candy
-
Abbie Taylor: Men's Cricket World Cup 2023 - Batting Partnerships
-
Keren Aharon: ESG Maturity Assessment
-
Dennis Kao: Warming Oceans
-
Jeff Plattner: My 2023 Peloton Fitness Tracker
-
Capstone Project GIGIH 12B: Capstone Project12
Community Projects
Back 2 Viz Basics
A bi-weekly project helping those who are newer in the community and just starting out with Tableau. Not limited just to newbies!
Web: Back 2 Viz Basics
Twitter: #B2VB
Week 21: Build a Scatter Plot
Workout Wednesday
Build your skills with a weekly challenge to re-create an interactive data visualization.
Web: Workout Wednesday
Twitter: #WOW2022
Week 49: Can you find how many quarters it took for a customer to order again?
Preppin' Data
A weekly challenge to help you learn to prepare data and use Tableau Prep.
Web: Preppin’ Data
Twitter: #PreppinData
Week 49: Regular Savings Accounts
DataFam Con
A monthly challenge covering pop culture and fandoms.
Web: DataFam Con
Twitter: #DataFamCon
December 2023: Holiday Movies
EduVizzers
A monthly project connecting real education data with real people.
Web: Eduvizzers
December 2023: Out-of-school Rates
Games Night Viz
A monthly project focusing on using data from your favorite games.
Web: Games Nights Viz
Twitter: #GamesNightViz
November 2023: Disney's Stacked Bar
Iron Quest
Practice data sourcing, preparation, and visualization skills in a themed monthly challenge.
Web: Iron Quest
Twitter: #IronQuest
White Space
Storytelling with Data
Practice data visualization and storytelling skills by participating in monthly challenges and exercises.
Web: Storytelling with Data
Twitter: #SWDChallenge
December 2023: visualise holiday traditions
Project Health Viz
Uncover new stories by visualizing healthcare data sets provided each month.
Web: Project Health Viz
Twitter: #ProjectHealthViz
October 2023: Customizing Shapes with Opacity in Tableau
Diversity in Data
An initiative centered around diversity, equity & awareness by visualizing provided datasets each month.
Web: Diversity in Data
Twitter: #DiversityinData
November 2023: Disney Demographics
Sports Viz Sunday
Create and share data visualizations using rich, sports-themed data sets in a monthly challenge.
Web: Sports Viz Sunday
Twitter: #SportsVizSunday
Viz for Social Good
Volunteer to design data visualizations that help nonprofits harness the power of data for social change.
Web: Viz for Social Good
Twitter: #VizforSocialGood
Oct 19—Nov 23, 2023: Physicalizing Data for a Better World
Real World Fake Data
Create business dashboards using provided data sets for various industries and departments.
Web: Real World Fake Data
Twitter: #RWFD
Session 6: HR Cross-Function Mobility
Makeover Monday
Create business dashboards using provided data sets for various industries and departments.
Web: Makeover Monday
Twitter: #MakeoverMonday
Data Plus Music
A monthly project visualizing the data behind the music we love!
Web: Data Plus Music
Twitter: #DataPlusMusic
Verwante verhalen
Meet Iron Viz 2024 Finalist Chris Westlake
 22 april, 2024
DataFam Roundup: April 15–19, 2024
 19 april, 2024
Meet Iron Viz 2024 Finalist Jessica Moon
15 april, 2024
Subscribe to our blog
Ontvang de nieuwste updates van Tableau in je inbox.