DataFam Roundup: November 13–17, 2023


Welcome! Dig into this week's DataFam Roundup—a weekly blog that brings together community content all in one post. As always, we invite you to send us your content—and the DataFam content from your peers that have inspired you! Find the content submission form here.
Community Highlight
To recognize new and consistent Tableau contributors—we’re excited to have a section within the weekly DataFam Roundup called the Tableau Community Highlight. Find out how to get involved.

Elaine Yuan, Tableau & Alteryx Consultant
New York, USA
Elaine Yuan is a Tableau & Alteryx Consultant. She was first introduced to Tableau at a Data Analyst Training Accelerator. After having created data visualizations in Excel and Python, Elaine was amazed at how much easier it was to create and customize the same charts in Tableau.
As an active participant in Tableau User Groups and Community Projects such as Back 2 Viz Basics, Makeover Monday, and Workout Wednesday, and an author on Tableau Public, Elaine stays active in a lot of different areas of the community. In addition, Elaine has also published numerous blogs about things she has learned or done, such as her experience creating an interactive resume dashboard, sharing AAPI and Pride month vizzes she created, and other Tableau tips.
On Tableau Public, Elaine shares vizzes centered around topics in popular culture, diversity and inclusion topics, the products of her participation in Community Projects, and more. In just under a year and a half, Elaine has published 80 vizzes on Tableau Public, in addition to her other involvements in the community.
Connect with Elaine on Linkedin, X, Tableau Public, and on her blog.
DataFam content
Dive into content created by the Tableau Community:
- Kevin Flerlage:
- Tiny Tableau Tips - Round 4
- Tableau Tip, If you are connected table in Tableau, you can click on the arrow & change it to Custom SQL.
- Dawn Harrington, Tech Tips Girl: Add Text to the End of a Tableau URL
- Logan Bartlett: Building Tableau: From Bootstrapped Beginnings to a $15.7B Salesforce Acquisition
- Andy Moore, The Data Leadership Collaborative: Driving Toward a Higher State of Data Analytics
- Jim Dehner: Viz-in-Tooltip
- Adam Mico and Vanessa Grant: Trailblazer & DataFam Communities | 5 Queries, 2 Delegates Decode
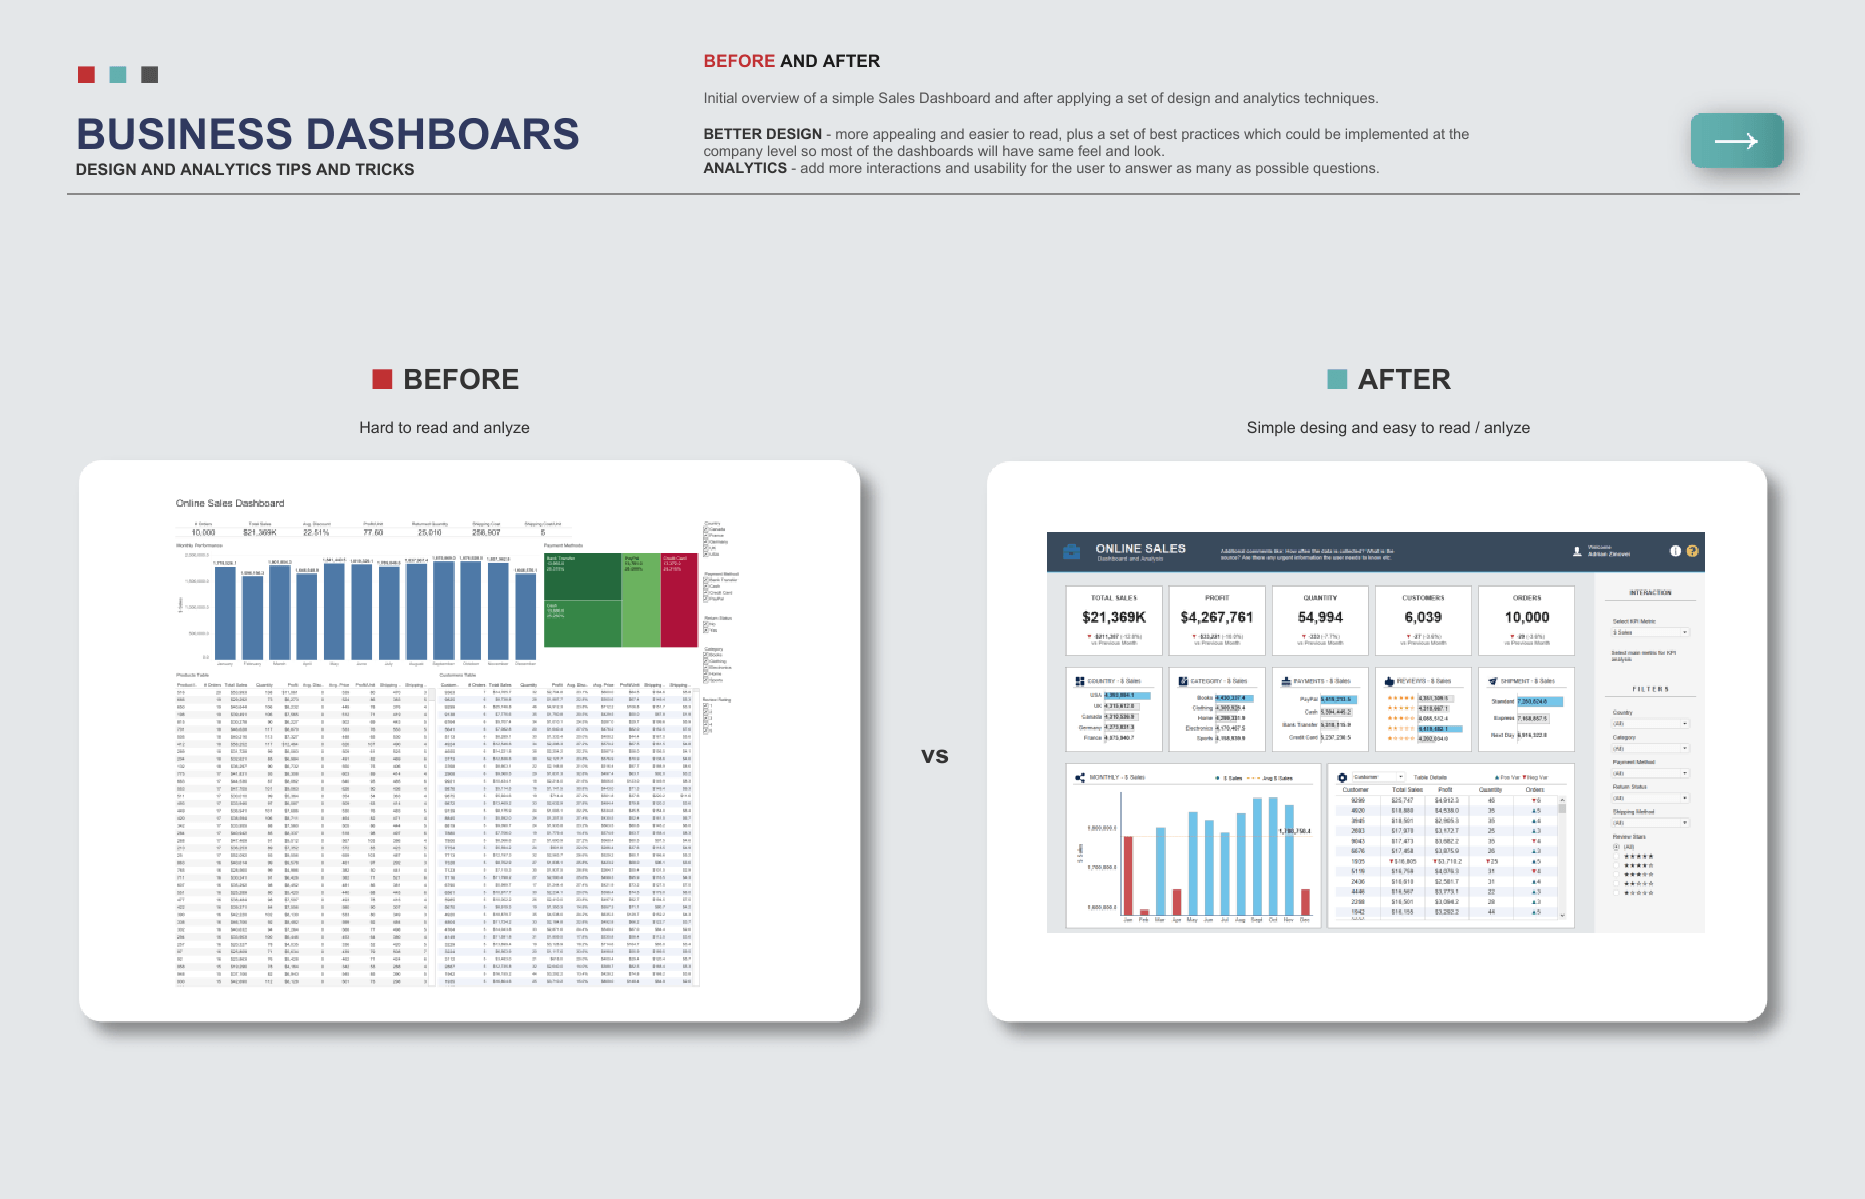
- Adrian Zinovei: Business Dashboards: Before and After Design Best Practices
Team Tableau
- New vizzes and favorites are available on the Recent Activity channel in Tableau Public.
- 7 Ways to Stand Out and Secure Your Next Data Analytics Role
- Transforming Ideas into Features: Tableau's Commitment to Community-Driven Innovation
Upcoming events and community participation
-
Lights, Camera, Action: Tableau and IMDb Launch Data Visualization Campaign for Movie Lovers
-
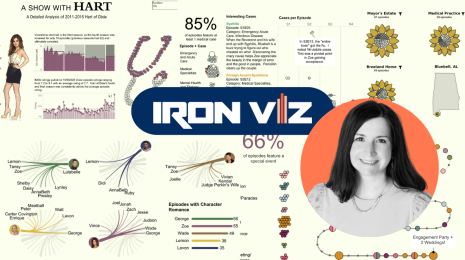
2024 Iron Viz Qualifiers: Top 10 Results Jan 17, 2024, 9:00 AM (PST) Virtual Event - Find out the top 10 Tableau Public visualizations, including the 3 finalists selected to compete in the 2024 Iron Viz Championship.
-
READY TO SUPERCHARGE YOUR DATA SKILLS? The Information Lab has free, on demand training courses will help you to make sense of your data and take you from zero to data hero. Developed by our industry leading trainers, our expansive courses cover the basics to intermediate levels of Tableau, Alteryx and Tableau Prep! You can take advantage of the whole course or simply choose the modules you need to brush up on your skills. Start your data journey today by simply selecting your training course below.
-
Demystifying the way to learn Data Visualization! Are you looking for a way to learn Data Visualization and feeling lost? We all have been there and I am going to help you understand the fundamentals and look for a way to learn data visualization.
-
Viz Collab: Hello everyone! I’m excited to be opening #VizCollab back up for another round of matches! In the last year I matched around 40 people for some amazing vizzes, including Viz of the Days and a viz that was featured in a local publication. So if you want to find a collaboration partner sign up.
-
Local Community Conferences by the DataFam, for the DataFam: VizIt Berlin
Vizzes
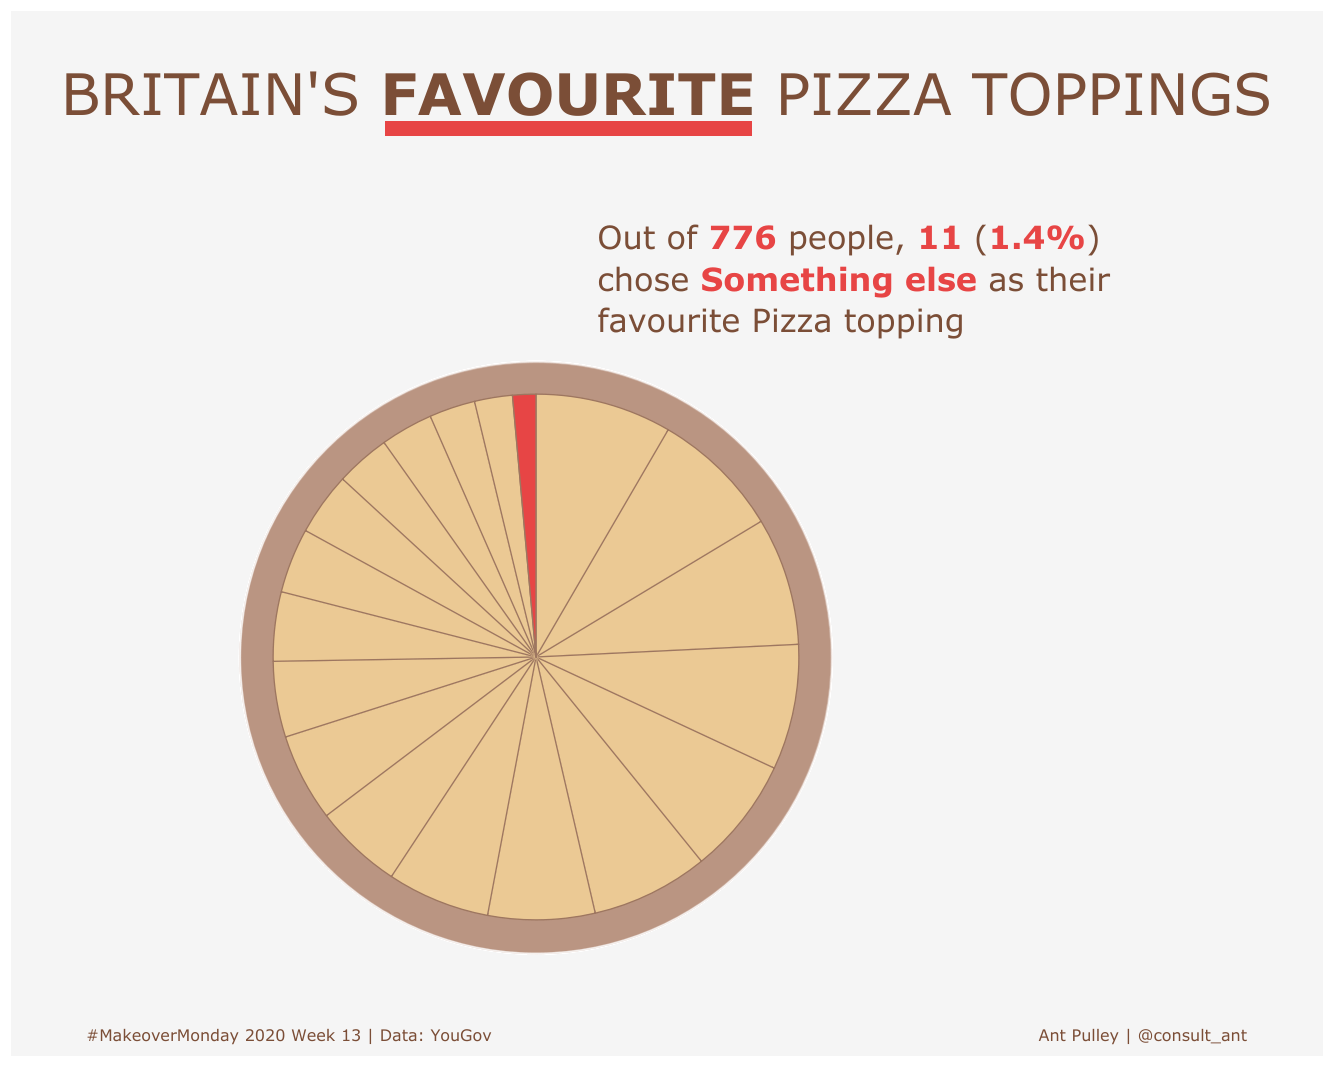
Ant Pulley: Britains Favourite Pizza Toppings
See the latest Viz of the Day, trending vizzes, featured authors, and more on Tableau Public.
Check out some inspirational vizzes created by the community:
-
Stop AAPI Hate: Stop AAPI Hate Data Visualization Tool
-
Ant Pulley: Britains Favourite Pizza Toppings
-
Sebastine: TESLA Stock Price
-
Iris van Bussel: Hogwarts Houses in the Harry Potter Movies
-
Caroline Swiger: Allowance Primer: What is a Bank's Allowance for Credit Losses?
-
Saverio Rocchetti: SUPERSTORE DASHBOARD
-
Maureen Okonkwo: Web Traffic Dashboard | Executive Overview
Community Projects
Back 2 Viz Basics
A bi-weekly project helping those who are newer in the community and just starting out with Tableau. Not limited just to newbies!
Web: Back 2 Viz Basics
Twitter: #B2VB
Week 21: Build a Scatter Plot
Workout Wednesday
Build your skills with a weekly challenge to re-create an interactive data visualization.
Web: Workout Wednesday
Twitter: #WOW2022
Week 45: Help me choose my wine
Preppin' Data
A weekly challenge to help you learn to prepare data and use Tableau Prep.
Web: Preppin’ Data
Twitter: #PreppinData
Week 46: Late For School
DataFam Con
A monthly challenge covering pop culture and fandoms.
Web: DataFam Con
Twitter: #DataFamCon
November 2023: Let’s go on an Adventure! With Tableau’s Data Plus Movies
EduVizzers
A monthly project connecting real education data with real people.
Web: Eduvizzers
November 2023: Scholarship Recipients and Dollars by College Code: Beginning 2009
Games Night Viz
A monthly project focusing on using data from your favorite games.
Web: Games Nights Viz
Twitter: #GamesNightViz
Season 2: Battle of the Strongest
Iron Quest
Practice data sourcing, preparation, and visualization skills in a themed monthly challenge.
Web: Iron Quest
Twitter: #IronQuest
White Space
Storytelling with Data
Practice data visualization and storytelling skills by participating in monthly challenges and exercises.
Web: Storytelling with Data
Twitter: #SWDChallenge
November 2023: create a clever combo chart
Project Health Viz
Uncover new stories by visualizing healthcare data sets provided each month.
Web: Project Health Viz
Twitter: #ProjectHealthViz
June 2023: Funding for Research for Various Conditions and Diseases
Diversity in Data
An initiative centered around diversity, equity & awareness by visualizing provided datasets each month.
Web: Diversity in Data
Twitter: #DiversityinData
May 2023: Mental Health Awareness Month and LGBTQ+ Representation in film
Sports Viz Sunday
Create and share data visualizations using rich, sports-themed data sets in a monthly challenge.
Web: Sports Viz Sunday
Twitter: #SportsVizSunday
Viz for Social Good
Volunteer to design data visualizations that help nonprofits harness the power of data for social change.
Web: Viz for Social Good
Twitter: #VizforSocialGood
Oct 19—Nov 23, 2023: Physicalizing Data for a Better World
Real World Fake Data
Create business dashboards using provided data sets for various industries and departments.
Web: Real World Fake Data
Twitter: #RWFD
Session 5: Diversity Score Card
Makeover Monday
A weekly social data project. Web: Makeover MondayTwitter: #MakeoverMonday
Data Plus Music
A monthly project visualizing the data behind the music we love!
Web: Data Plus Music
Twitter: #DataPlusMusic
Verwante verhalen
Meet Iron Viz 2024 Finalist Chris Westlake
 22 april, 2024
DataFam Roundup: April 15–19, 2024
 19 april, 2024
Meet Iron Viz 2024 Finalist Jessica Moon
15 april, 2024
Subscribe to our blog
Ontvang de nieuwste updates van Tableau in je inbox.