DataFam Roundup: November 27–December 1, 2023


Welcome! Dig into this week's DataFam Roundup—a weekly blog that brings together community content all in one post. As always, we invite you to send us your content—and the DataFam content from your peers that have inspired you! Find the content submission form here.
Community Highlight
To recognize new and consistent Tableau contributors—we’re excited to have a section within the weekly DataFam Roundup called the Tableau Community Highlight. Find out how to get involved.

Chris Westlake, Senior BI Analyst at JLL
Edinburgh, Scotland
Chris Westlake is a Senior BI Analyst at JLL. He stays involved in the community by participating in Community Projects, publishing vizzes on Tableau Public, and co-leading the Scotland Tableau User Group.
Chris was introduced to Tableau as a student and was amazed at how quickly raw data is transformed into a visually appealing chart using the tool. In his learning journey, practicing using Community Projects, especially Makeover Monday and SportsVizSunday, and attending Tableau User Groups were invaluable to Chris. However, he felt a gap as there was no User Group in his geographic area. When the Scotland Tableau User Group came to life, Chris was keen to give back and share his experience with the community by serving as a co-leader.
At work, Chris uses Tableau everyday but he also uses it outside of work to analyze data connected with his passions. This ranges from vizzes containing sports data to addressing social issues such as the global hunger crisis, many of which he publishes to Tableau Public.
Connect with Chris on Linkedin, X, and Tableau Public.
DataFam content
Dive into content created by the Tableau Community:
- Klaus Schulte: Data Mapping For Everyone
- Jim Dehner:
- Annabelle Rincon: Creating the DataFam Advent Calendar viz
- Autumn Battani: Master the Art of Feedback
- Solomon Kahn, Data Leadership Collaborative: AI + Data: 5 Ways to Maximize Your Impact
- Donna Coles: How to annotate a mark that changes in Tableau
- Zach Bowders, Data + Love: Authenticity and Kindness in Data with Vince Baumel
- AllAboutDATA: Tableau Desktop Specialist Exam Practice Questions
- Emily Kund: Alt-texting charts
- Bridget Cogley: How to create a career in data visualization
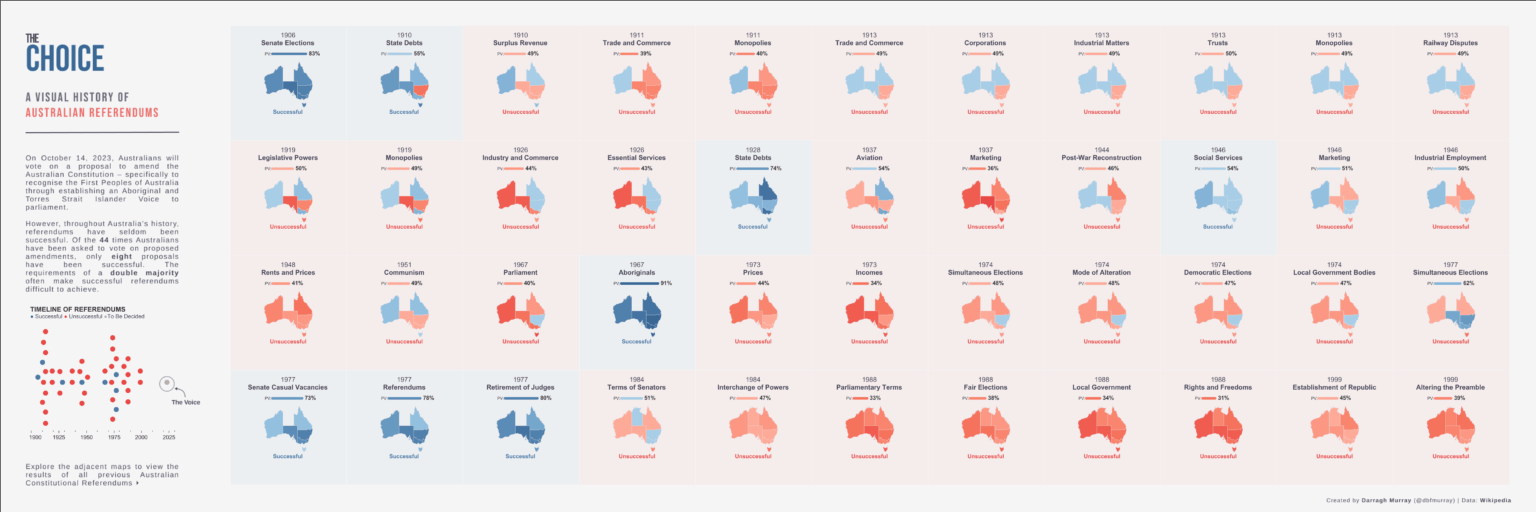
- Darragh Murray: Iterative Visual Design and The Choice Visual
- Sarah Bartlett: VizIt Berlin 2023 Reflections
- Data Viz Canvas: How to add "All" value to Tableau Dynamic Parameter
- Dawn Harrington, Tech Tips Girl: The Text in a Table Problem
- Júlia Borsi and István Korompai, The Viz Collective: An ode to pies and pie alternatives
- Andy Kriebel, VizWiz: The Fundamentals of Logical Functions - IF THEN vs. Case
Team Tableau
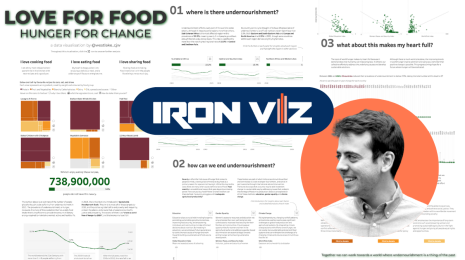
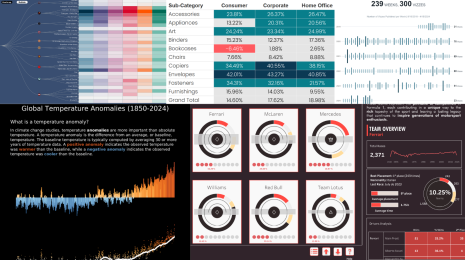
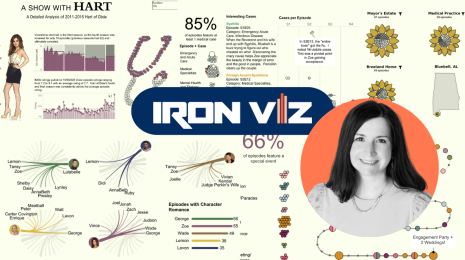
- Explore the 2024 Iron Viz Entries
- New vizzes and favorites are available on the Recent Activity channel in Tableau Public.
- 7 Ways to Stand Out and Secure Your Next Data Analytics Role
- Transforming Ideas into Features: Tableau's Commitment to Community-Driven Innovation
Upcoming events and community participation
-
Apply or Nominate to Become a 2024 Tableau Visionary by 11:59 PM (PT), Thursday, January 11, 2024.
-
#TableauNext 2024 Nominations: Nominate individuals who have significantly impacted the DataFam through their work with Tableau or Salesforce, but are not yet recognized as Visionaries, employees, or Ambassadors. Nominations close at 11:59 PM (ET) on December 29th.
-
Lights, Camera, Action: Tableau and IMDb Launch Data Visualization Campaign for Movie Lovers
-
2024 Iron Viz Qualifiers: Top 10 Results January 17, 2024, 9:00 AM (PT) Virtual Event - Find out the top 10 Tableau Public visualizations, including the 3 finalists selected to compete in the 2024 Iron Viz Championship.
-
READY TO SUPERCHARGE YOUR DATA SKILLS? The Information Lab has free, on demand training courses will help you to make sense of your data and take you from zero to data hero. Developed by our industry leading trainers, our expansive courses cover the basics to intermediate levels of Tableau, Alteryx and Tableau Prep! You can take advantage of the whole course or simply choose the modules you need to brush up on your skills. Start your data journey today by simply selecting your training course below.
-
Demystifying the way to learn Data Visualization! Are you looking for a way to learn Data Visualization and feeling lost? We all have been there and I am going to help you understand the fundamentals and look for a way to learn data visualization.
-
Viz Collab: Hello everyone! I’m excited to be opening #VizCollab back up for another round of matches! In the last year I matched around 40 people for some amazing vizzes, including Viz of the Days and a viz that was featured in a local publication. So if you want to find a collaboration partner sign up.
Vizzes
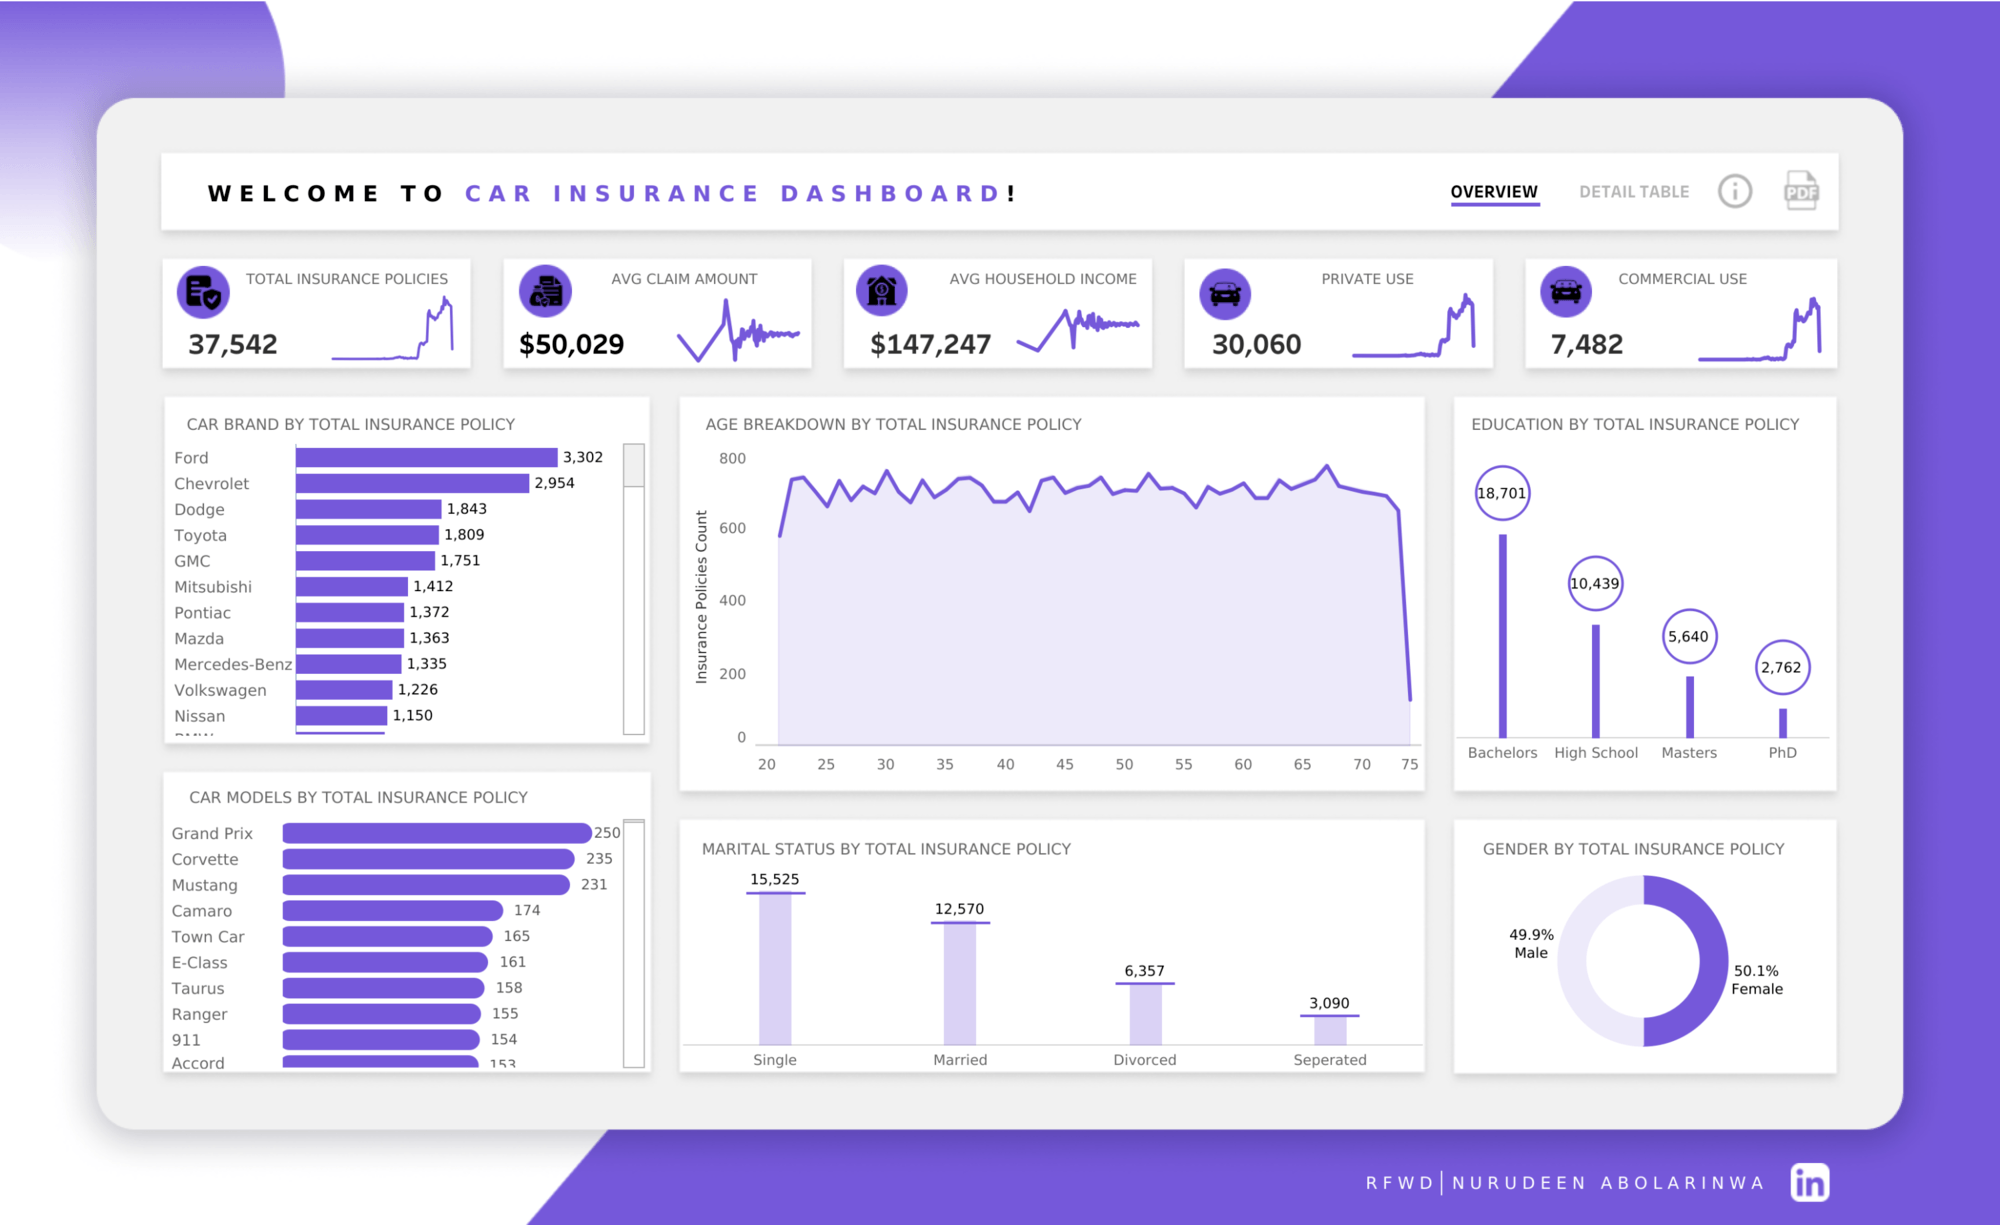
Nurudeen Abolarinwa: Car Insurance Policies Dashboard
See the latest Viz of the Day, trending vizzes, featured authors, and more on Tableau Public.
Check out some inspirational vizzes created by the community:
-
Nurudeen Abolarinwa: Car Insurance Policies Dashboard #RWFD
-
George Gorczynski: Income Statement
-
David ó Cinnéide: Radial Marimekko
Community Projects
Back 2 Viz Basics
A bi-weekly project helping those who are newer in the community and just starting out with Tableau. Not limited just to newbies!
Web: Back 2 Viz Basics
Twitter: #B2VB
Week 21: Build a Scatter Plot
Workout Wednesday
Build your skills with a weekly challenge to re-create an interactive data visualization.
Web: Workout Wednesday
Twitter: #WOW2022
Week 48: Can you add candlesticks to bar charts?
Preppin' Data
A weekly challenge to help you learn to prepare data and use Tableau Prep.
Web: Preppin’ Data
Twitter: #PreppinData
Week 48: Reporting Week Calendars
DataFam Con
A monthly challenge covering pop culture and fandoms.
Web: DataFam Con
Twitter: #DataFamCon
November 2023: Let’s go on an Adventure! With Tableau’s Data Plus Movies
EduVizzers
A monthly project connecting real education data with real people.
Web: Eduvizzers
November 2023: Scholarship Recipients and Dollars by College Code: Beginning 2009
Games Night Viz
A monthly project focusing on using data from your favorite games.
Web: Games Nights Viz
Twitter: #GamesNightViz
November 2023: Disney's Stacked Bar
Iron Quest
Practice data sourcing, preparation, and visualization skills in a themed monthly challenge.
Web: Iron Quest
Twitter: #IronQuest
White Space
Storytelling with Data
Practice data visualization and storytelling skills by participating in monthly challenges and exercises.
Web: Storytelling with Data
Twitter: #SWDChallenge
November 2023: Create a clever combo chart
Project Health Viz
Uncover new stories by visualizing healthcare data sets provided each month.
Web: Project Health Viz
Twitter: #ProjectHealthViz
October 2023: Customizing Shapes with Opacity in Tableau
Diversity in Data
An initiative centered around diversity, equity & awareness by visualizing provided datasets each month.
Web: Diversity in Data
Twitter: #DiversityinData
November 2023: Disney Demographics
Sports Viz Sunday
Create and share data visualizations using rich, sports-themed data sets in a monthly challenge.
Web: Sports Viz Sunday
Twitter: #SportsVizSunday
Viz for Social Good
Volunteer to design data visualizations that help nonprofits harness the power of data for social change.
Web: Viz for Social Good
Twitter: #VizforSocialGood
Oct 19—Nov 23, 2023: Physicalizing Data for a Better World
Real World Fake Data
Create business dashboards using provided data sets for various industries and departments.
Web: Real World Fake Data
Twitter: #RWFD
Session 6: HR Cross-Function Mobility
Makeover Monday
Create business dashboards using provided data sets for various industries and departments.
Web: Makeover Monday
Twitter: #MakeoverMonday
Data Plus Music
A monthly project visualizing the data behind the music we love!
Web: Data Plus Music
Twitter: #DataPlusMusic
Verwante verhalen
Meet Iron Viz 2024 Finalist Chris Westlake
 22 april, 2024
DataFam Roundup: April 15–19, 2024
 19 april, 2024
Meet Iron Viz 2024 Finalist Jessica Moon
15 april, 2024
Subscribe to our blog
Ontvang de nieuwste updates van Tableau in je inbox.