DataFam Roundup: April 15–19, 2024


Welcome! Dig into this week's DataFam Roundup—a weekly blog that brings together community content all in one post. As always, we invite you to send us your content—and the DataFam content from your peers that have inspired you! Find the content submission form here.
Community Highlight
To recognize new and consistent Tableau contributors—we’re excited to have a section within the weekly DataFam Roundup called the Tableau Community Highlight. Find out how to get involved.

Jun Yan Yeo, Singapore Land Transport Authority Deputy Manager
Singapore
Jun Yan Yeo is the Deputy Manager at the Singapore Land Transport Authority. He is involved in the Tableau Community in a variety of ways including participating in the Singapore Tableau User Group, publishing vizzes on Tableau Public, and writing a blog on his Tableau learnings and experience.
After beginning to read books about data visualization, Jun was inspired to start his blog as a place to write and share book reviews, with the overarching goal of contributing to the DataFam in a unique way. He now also uses his blog as a place to share Tableau tips and techniques that he believes are less popular and not as widely explained. In the future, Jun plans on writing a course or book about data visualization in Tableau.
Connect with Jun on Linkedin, X, Tableau Public, and on his blog.
DataFam content
Dive into content created by the Tableau Community:
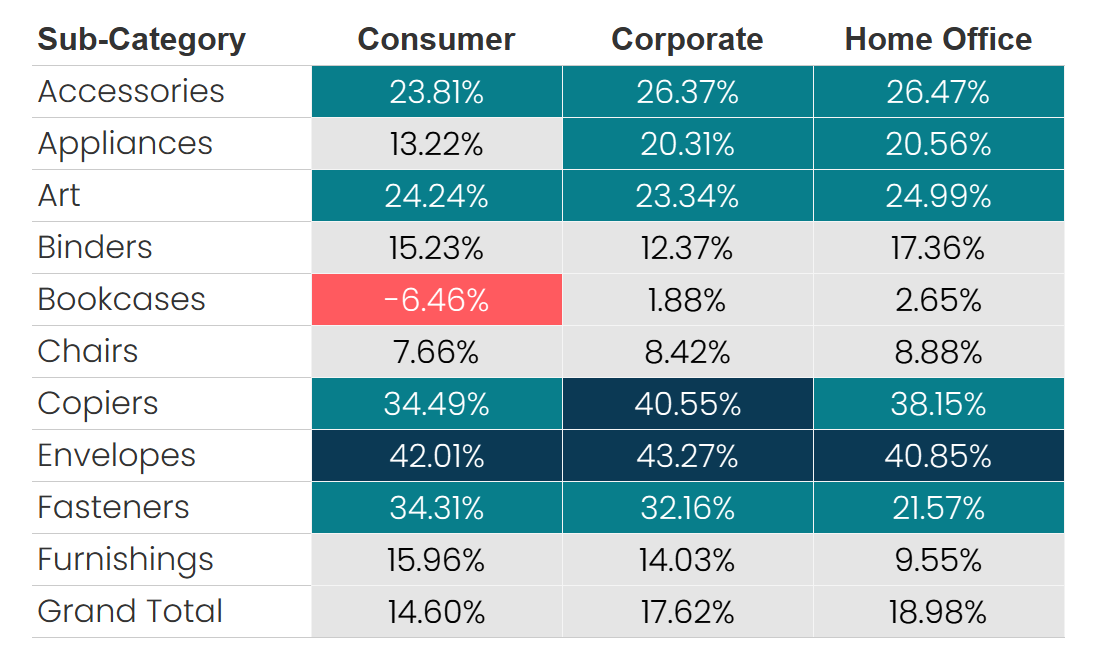
Ken Flerlage, The Flerlage Twins: 4 Ways to Create Highlight Tables in Tableau Using Discrete Color
-
Maya Mikhailov, The Data Leadership Collaborative: 5 Lessons I Learned from AI Hype
-
Viz for Social Good: World Art Day
-
Joon Kim: How can we embed shape-shifting superpowers into a dashboard?
-
Garvit Pant: Deployment of Tableau Server
-
Steve Martin:
-
Ken Flerlage, The Flerlage Twins: 4 Ways to Create Highlight Tables in Tableau Using Discrete Color
-
Steffen Volkerding: Quickie: how often do our sales staff need more days than the allowed threshold between sales?
-
Deepak Holla: Tableau Topic: Descending Vs Ascending Order in Rank Table Calculations
-
Sean Miller: #WOW2024 Tableau Live Stream | week 16
-
Dawn Harrington: Enhancing Your Line Chart
Team Tableau
Upcoming events and community participation
-
Lights, Camera, Action: Tableau and IMDb Launch Data Visualization Campaign for Movie Lovers
-
Free headshots at the Data + Women event at Tableau Conference 2024: Sunday, April 24, 2024 from 7:00pm-9:00pm at the San Diego Wine & Culinary Event Center. Register here!
Vizzes
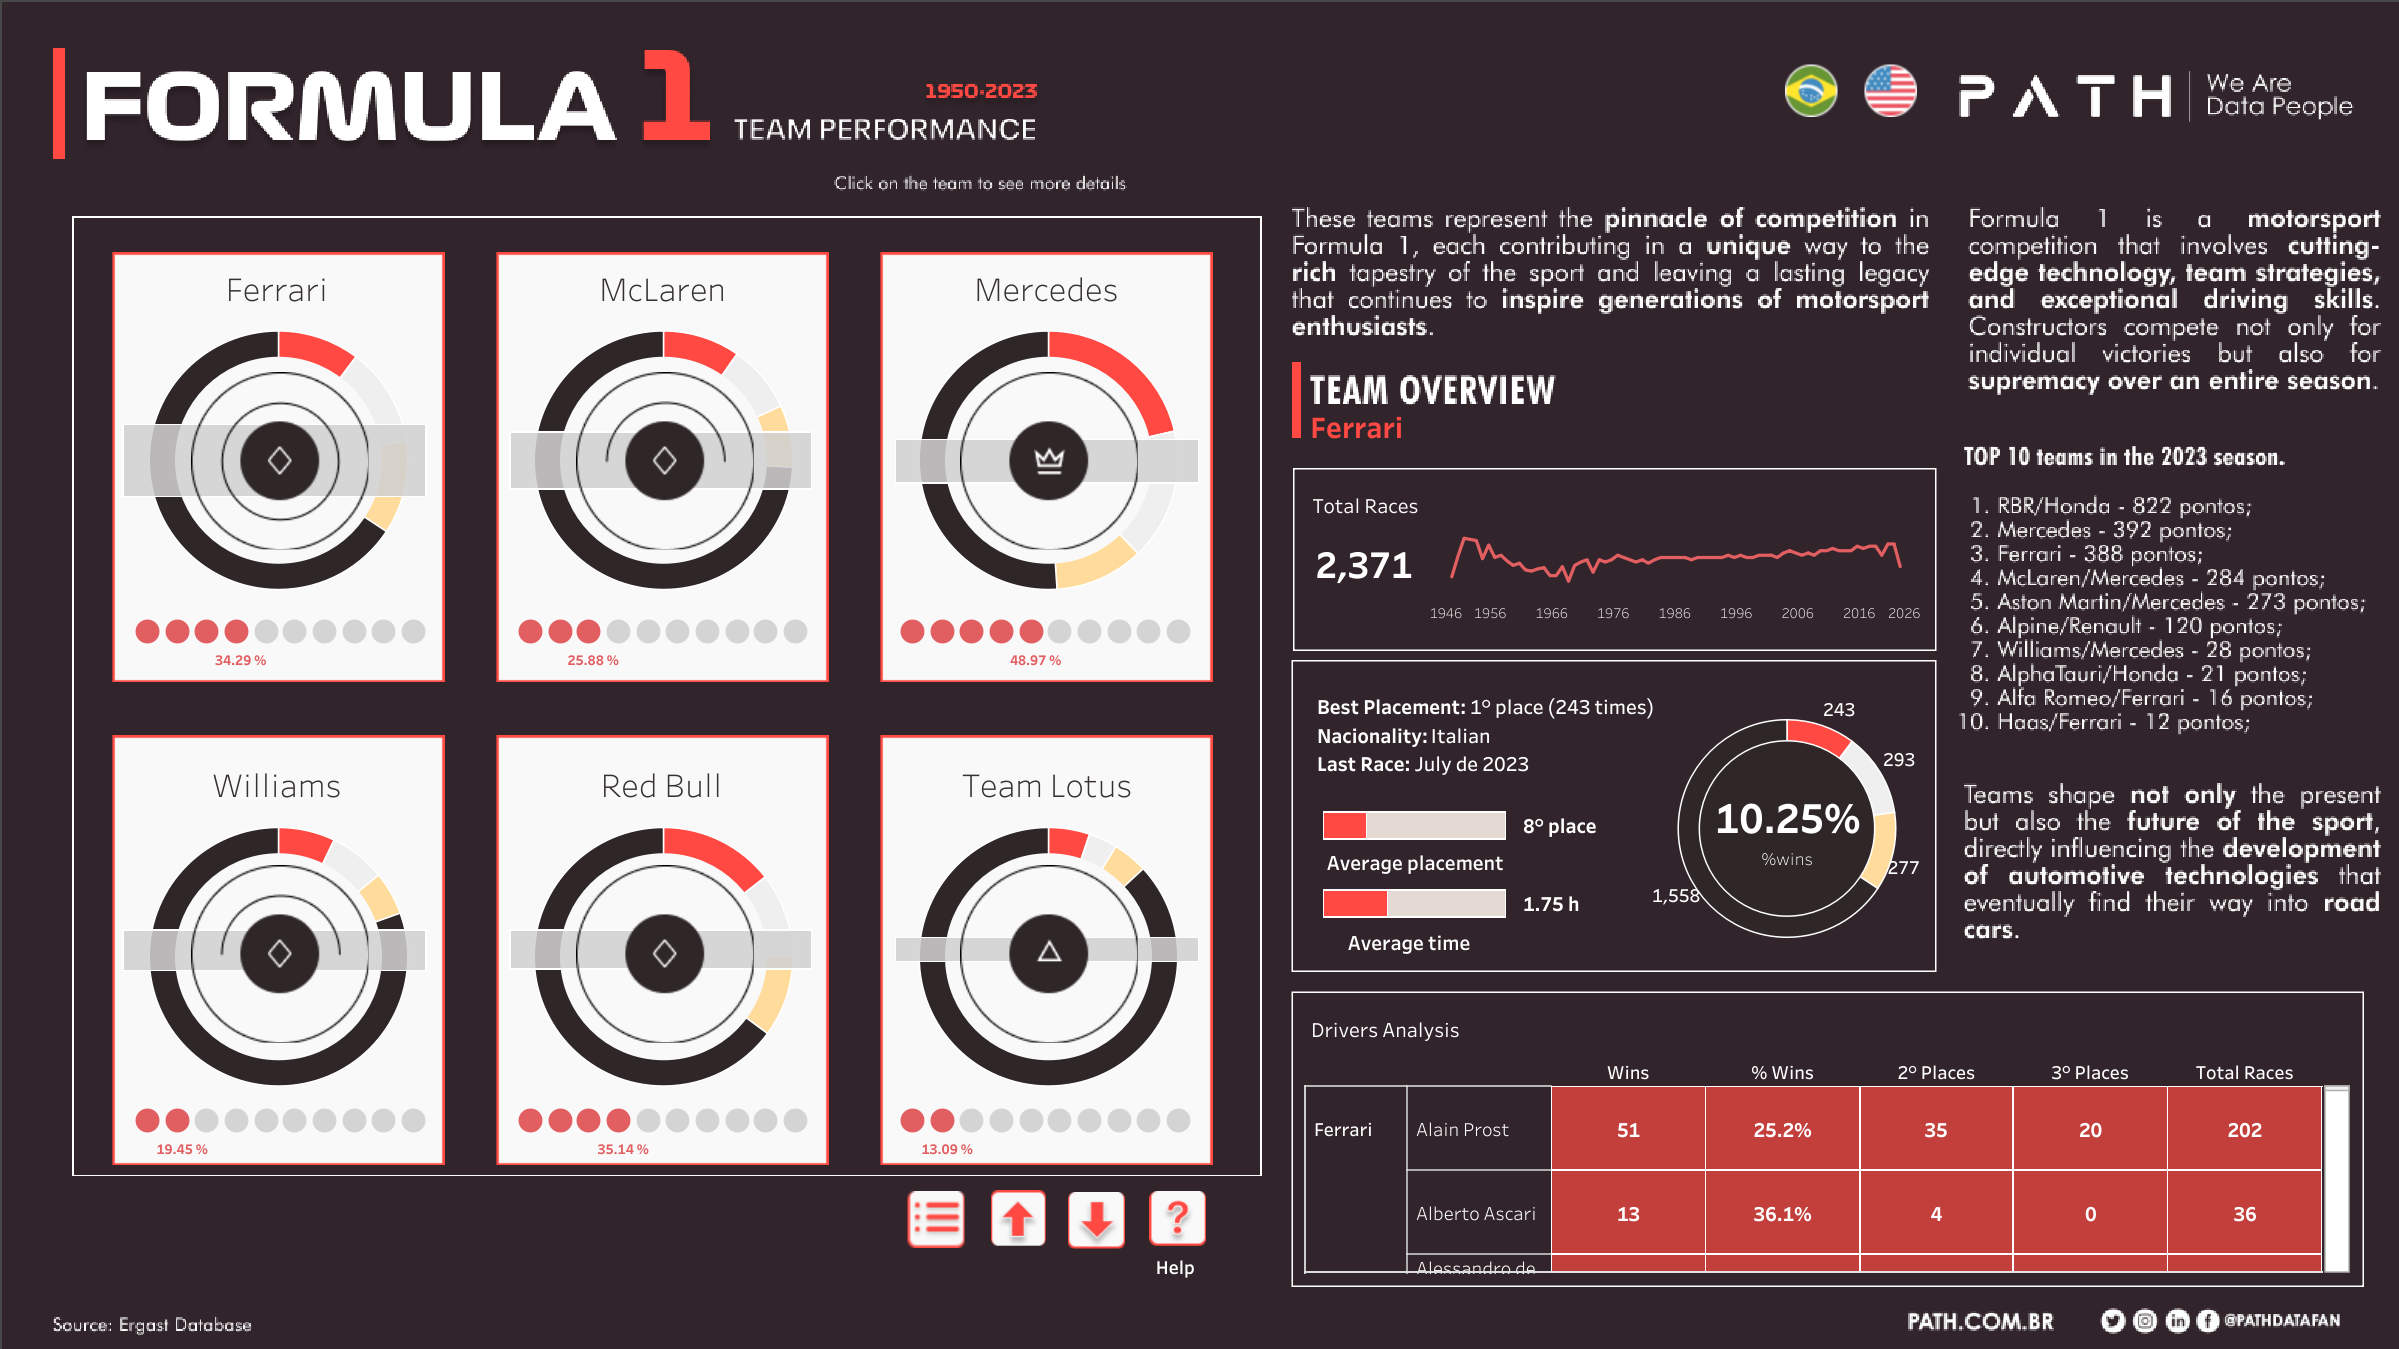
P A T H | We Are Data People: Formula 01
See the latest Viz of the Day, trending vizzes, featured authors, and more on Tableau Public.
Check out some inspirational vizzes created by the community:
-
Serena Purslow: The Price of Prosperity - C02 emissions, GDP and Population trends Globally
-
Takafumi Shukuya: My Tableau Public Journey
-
Sherzodbek Ibragimov: The Best Performing Marvel Movies
-
Arshi Saleh: Public Perception of Demographics in America - #30DayChartChallenge | Day5
-
P A T H | We Are Data People: Formula 01
-
Tobiloba Babajide: Retail Dashboard
-
Shivam Tiwari: 30 Day Chart Challenge Day 15/16
-
Mohit Kumar: The Magic of Shreya
Community Projects
Recreations of W.E.B Dubois's Data Portraits
Recreations of W.E.B Dubois's Data Portraits
Web: W.E.B. Dubois's Data Portraits
Twitter: #DubiosChallenge
Back 2 Viz Basics
A bi-weekly project helping those who are newer in the community and just starting out with Tableau. Not limited just to newbies!
Web: Back 2 Viz Basics
Twitter: #B2VB
Week 8: Create a Percent of Total Chart
Workout Wednesday
Build your skills with a weekly challenge to re-create an interactive data visualization.
Web: Workout Wednesday
Twitter: #WOW2022
Week 16: Can you create a sales dashboard by effectively utilizing headers?
Preppin' Data
A weekly challenge to help you learn to prepare data and use Tableau Prep.
Web: Preppin’ Data
Twitter: #PreppinData
Week 16: Budget vs Actuals
DataFam Con
A monthly challenge covering pop culture and fandoms.
Web: DataFam Con
Twitter: #DataFamCon
March 2024 Challenge: Sports Movies Edition
Makeover Monday
Create business dashboards using provided data sets for various industries and departments.
Web: Makeover Monday
Twitter: #MakeoverMonday
Week 15: The Conservatives’ economic record since 2010 in 10 charts
EduVizzers
A monthly project connecting real education data with real people.
Web: Eduvizzers
April 2024: School Bullying
Viz for Social Good
Volunteer to design data visualizations that help nonprofits harness the power of data for social change.
Web: Viz for Social Good
Twitter: #VizforSocialGood
March 15 - April 19, 2023: Visualizing the Social Impact of Viz for Social Good
Games Night Viz
A monthly project focusing on using data from your favorite games.
Web: Games Nights Viz
Twitter: #GamesNightViz
Season 2: With great power comes great vizzes
Iron Quest
Practice data sourcing, preparation, and visualization skills in a themed monthly challenge.
Web: Iron Quest
Twitter: #IronQuest
Women
Storytelling with Data
Practice data visualization and storytelling skills by participating in monthly challenges and exercises.
Web: Storytelling with Data
Twitter: #SWDChallenge
April 2024: Napoleon's April
Project Health Viz
Uncover new stories by visualizing healthcare data sets provided each month.
Web: Project Health Viz
Twitter: #ProjectHealthViz
October 2023: Customizing Shapes with Opacity in Tableau
Diversity in Data
An initiative centered around diversity, equity & awareness by visualizing provided datasets each month.
Web: Diversity in Data
Twitter: #DiversityinData
November 2023: Disney Demographics
Sports Viz Sunday
Create and share data visualizations using rich, sports-themed data sets in a monthly challenge.
Web: Sports Viz Sunday
Twitter: #SportsVizSunday
Real World Fake Data
Create business dashboards using provided data sets for various industries and departments.
Web: Real World Fake Data
Twitter: #RWFD
2024 - Admin Insights
Data Plus Music
A monthly project visualizing the data behind the music we love!
Web: Data Plus Music
Twitter: #DataPlusMusic
Histórias relacionadas

Product Innovations at Tableau Conference 2024
 30 Abril, 2024
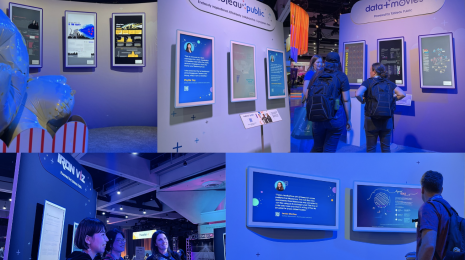
The Tableau Public Viz Gallery at Tableau Conference 2024
 29 Abril, 2024
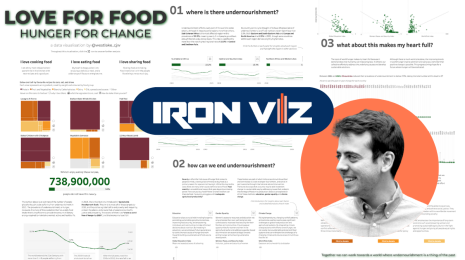
Meet Iron Viz 2024 Finalist Chris Westlake
 22 Abril, 2024
Subscribe to our blog
Receba em sua caixa de entrada as atualizações mais recentes do Tableau.