DataFam Roundup: February 19–23, 2024


Welcome! Dig into this week's DataFam Roundup—a weekly blog that brings together community content all in one post. As always, we invite you to send us your content—and the DataFam content from your peers that have inspired you! Find the content submission form here.
Community Highlight
To recognize new and consistent Tableau contributors—we’re excited to have a section within the weekly DataFam Roundup called the Tableau Community Highlight. Find out how to get involved.

Baraa Khatib Salkini, Data Projects Lead at Mercedes-Benz
Stuttgart, Germany
Baraa Khatib Salkini is the Data Projects Lead at Mercedes-Benz. Baraa stays involved in the Tableau Community by creating content on a variety of platforms.
Motivated by wanting to share his knowledge with a wider audience, Baraa creates videos on YouTube. Some of his most popular videos are end-to-end tutorials of building dashboards, beginner’s guides, and in-depth explanations of specific Tableau concepts.
In addition to sharing content on his YouTube channel, Baraa also shares blogs on his website, publishes vizzes on Tableau Public, and joins discussions on social media to further his knowledge sharing. Most notably, he has created a free Tableau course that guides users from the very basics all the way to creating a dashboard, available on his website.
Connect with Baraa on Linkedin, Tableau Public, on his YouTube channel, and on his website.
DataFam content
Dive into content created by the Tableau Community:
-
Matthias Giger: Resolved Issues Tableau Desktop, Prep and Server
-
Adam Mico:
-
Aaron Lower: Tableau Migration | Migrate to Cloud
-
Chitrang Dave, The Data Leadership Collaborative: 5 Crucial AI Skills for Today’s Data Leaders
-
Paula Muñoz: Du Bois Visualization Challenge 2024 - Original Plate 12
-
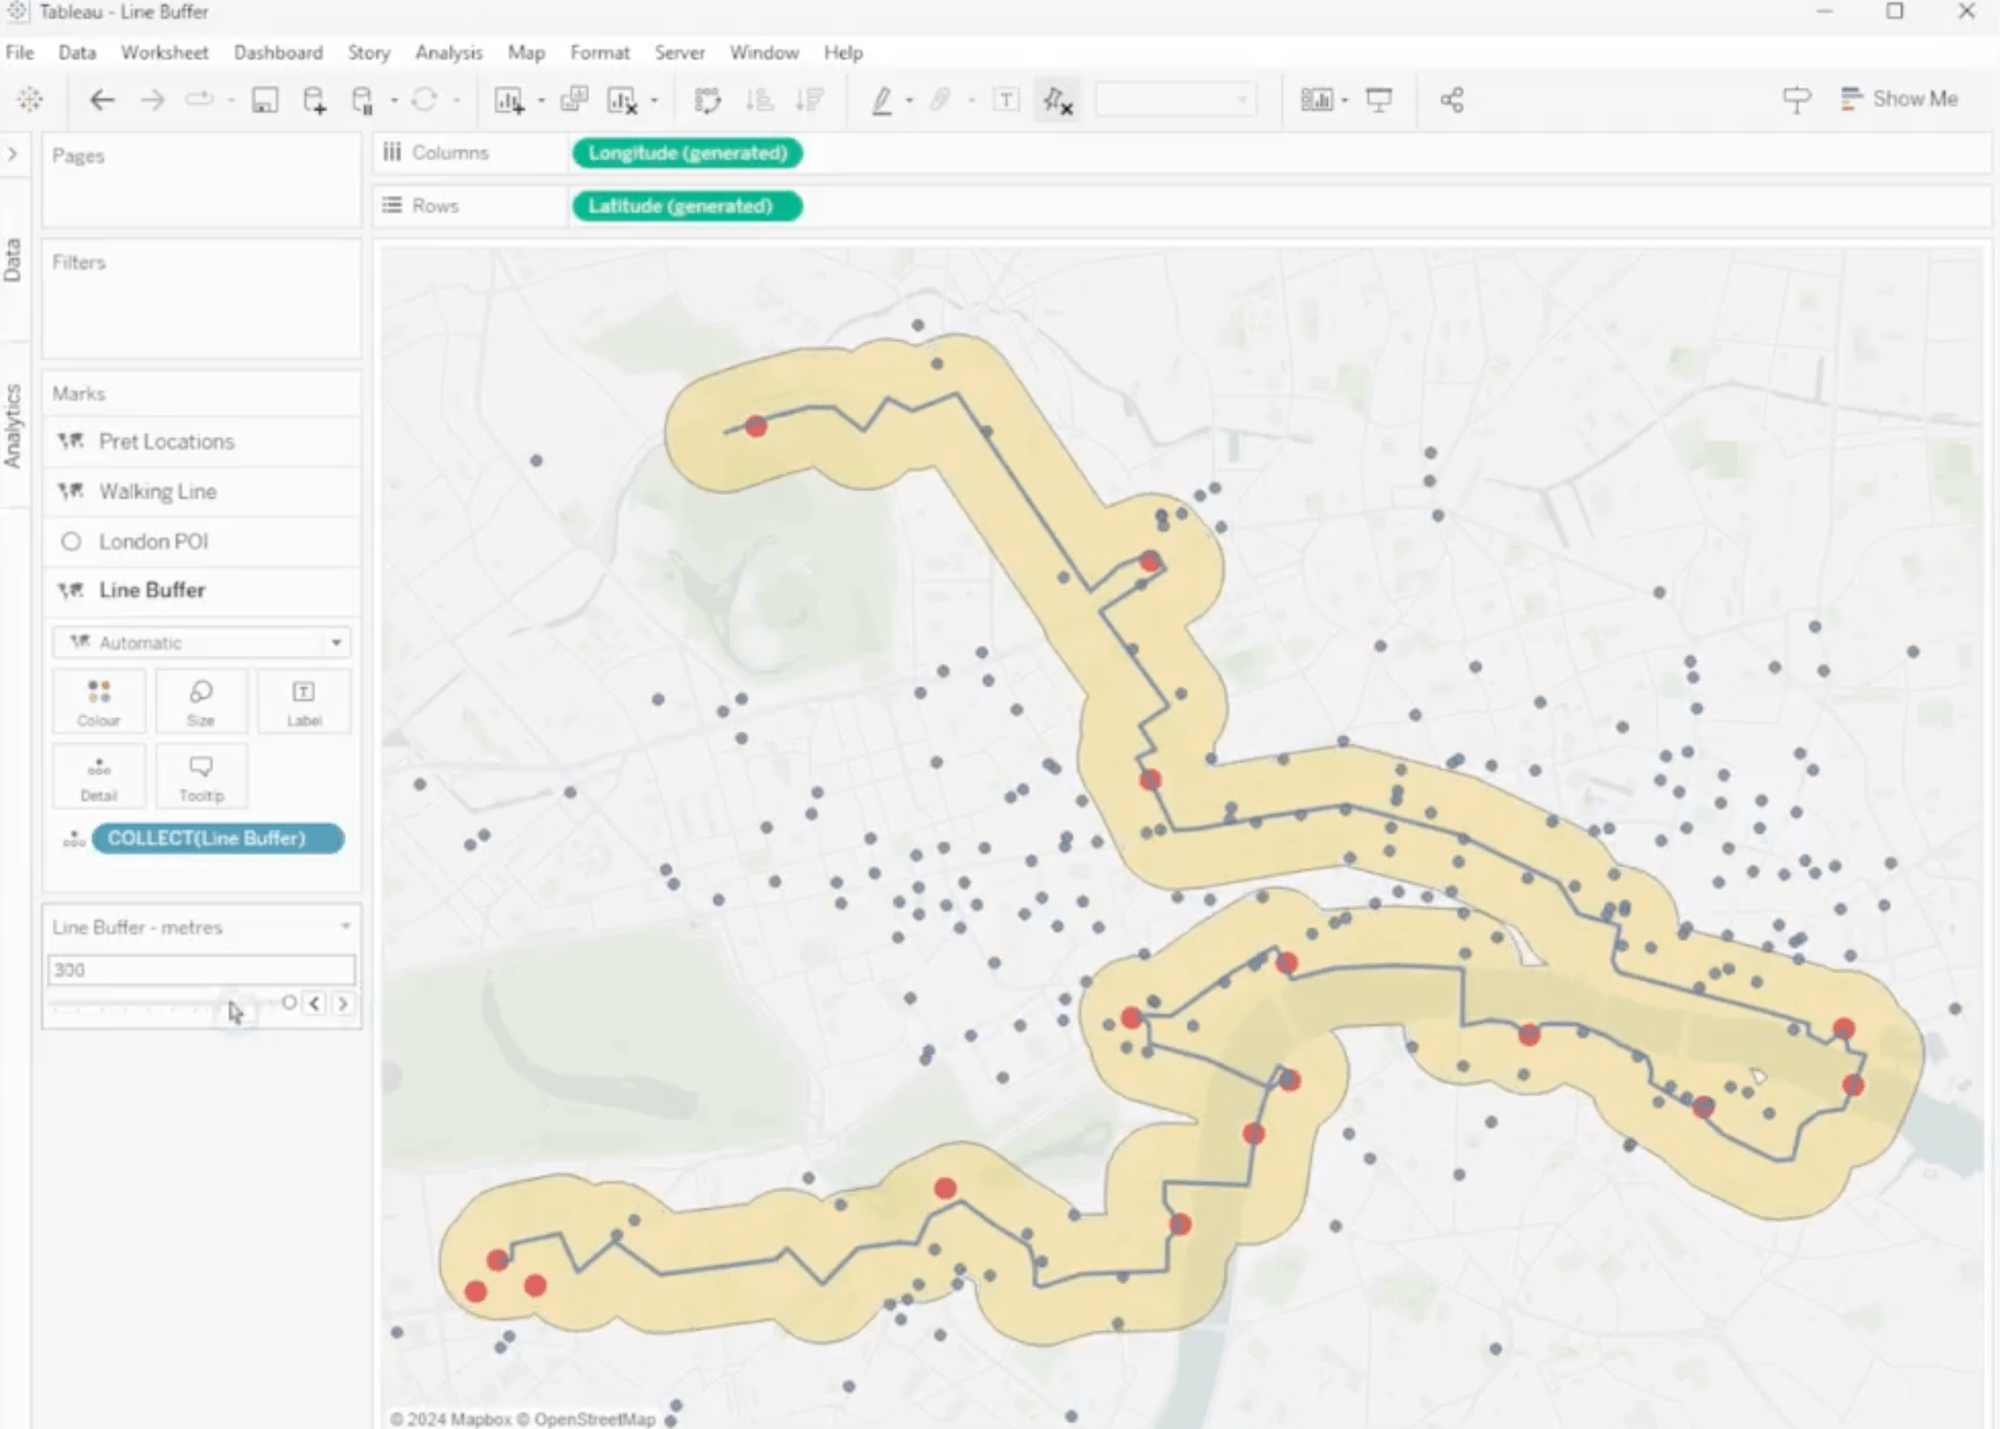
Marc Reid: Line String Buffers
Team Tableau
Upcoming events and community participation
-
2-day virtual Tableau training, February 17-18, 2024 by Tedy Iskandar
-
Lights, Camera, Action: Tableau and IMDb Launch Data Visualization Campaign for Movie Lovers
-
READY TO SUPERCHARGE YOUR DATA SKILLS? The Information Lab has free, on demand training courses will help you to make sense of your data and take you from zero to data hero. Developed by our industry leading trainers, our expansive courses cover the basics to intermediate levels of Tableau, Alteryx and Tableau Prep! You can take advantage of the whole course or simply choose the modules you need to brush up on your skills. Start your data journey today by simply selecting your training course below.
-
Demystifying the way to learn Data Visualization! Are you looking for a way to learn Data Visualization and feeling lost? We all have been there and I am going to help you understand the fundamentals and look for a way to learn data visualization.
-
Viz Collab: Hello everyone! I’m excited to be opening #VizCollab back up for another round of matches! In the last year I matched around 40 people for some amazing vizzes, including Viz of the Days and a viz that was featured in a local publication. So if you want to find a collaboration partner sign up.
Vizzes
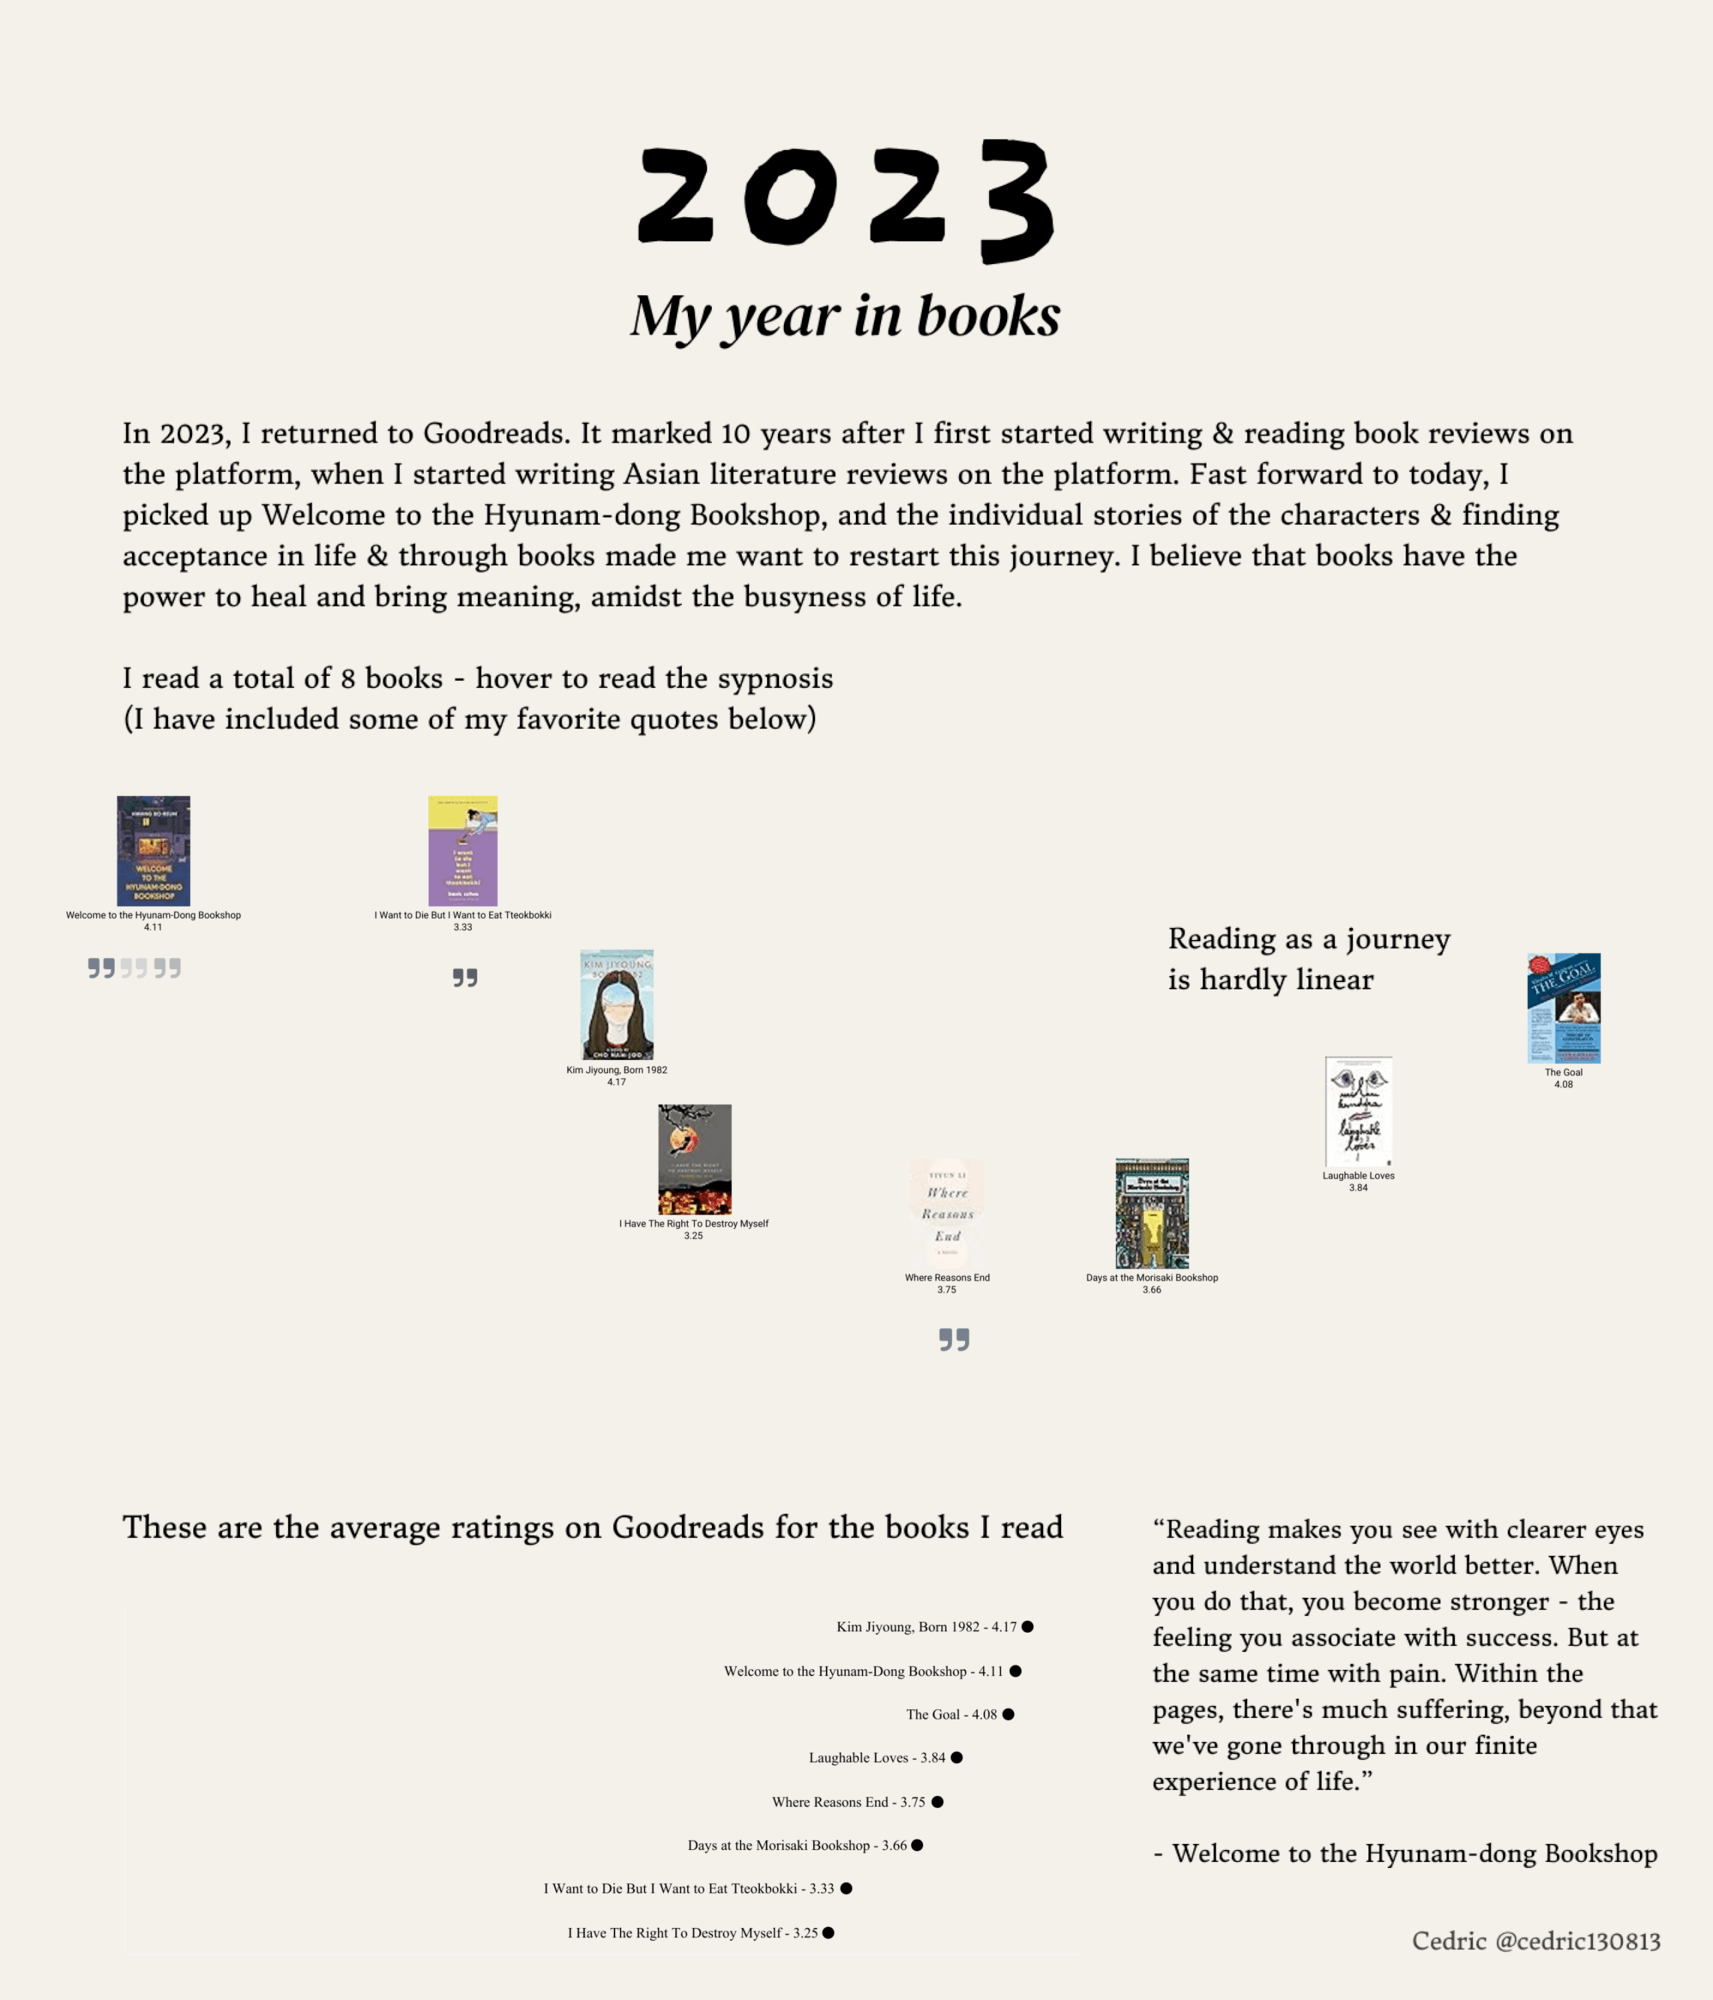
Ian Cedric Io: My Year In Books
See the latest Viz of the Day, trending vizzes, featured authors, and more on Tableau Public.
Check out some inspirational vizzes created by the community:
- Dawn Harrington: Beginner to Pop
- Dennis Kao: San Diego 1
- Alice McKnight: First Black Graduates of State Flagship Universities
- Sam Epley: #MakeoverMonday 2024 Week 8: Which Text-to-Image Models are Most Popular by State?
-
Uduak Afang: Generative AI Google Search Trends in America #MakeoverMonday wk8 - 24
- Shangruff Raina: Generative AI Search Trends in the USA || #MOM2024 Week8
- Ian Cedric Io: My Year In Books
- Huma Gonen: Olympics_data_viz_project
Community Projects
Recreations of W.E.B Dubois's Data Portraits
Recreations of W.E.B Dubois's Data Portraits
Web: W.E.B. Dubois's Data Portraits
Twitter: #DubiosChallenge
Back 2 Viz Basics
A bi-weekly project helping those who are newer in the community and just starting out with Tableau. Not limited just to newbies!
Web: Back 2 Viz Basics
Twitter: #B2VB
Week 4: Build a Bar Chart
Workout Wednesday
Build your skills with a weekly challenge to re-create an interactive data visualization.
Web: Workout Wednesday
Twitter: #WOW2022
Week 8: Can you create an area chart tile map?
Preppin' Data
A weekly challenge to help you learn to prepare data and use Tableau Prep.
Web: Preppin’ Data
Twitter: #PreppinData
Week 7: Prep Air Loyalty
DataFam Con
A monthly challenge covering pop culture and fandoms.
Web: DataFam Con
Twitter: #DataFamCon
February 2024 Challenge: Unveiling Romance
EduVizzers
A monthly project connecting real education data with real people.
Web: Eduvizzers
February 2024: SPP compared to SPS Kindergarteners | City of Seattle Open Data Portal
Games Night Viz
A monthly project focusing on using data from your favorite games.
Web: Games Nights Viz
Twitter: #GamesNightViz
Season 2: With great power comes great vizzes
Iron Quest
Practice data sourcing, preparation, and visualization skills in a themed monthly challenge.
Web: Iron Quest
Twitter: #IronQuest
White Space
Storytelling with Data
Practice data visualization and storytelling skills by participating in monthly challenges and exercises.
Web: Storytelling with Data
Twitter: #SWDChallenge
February 2024: recommended reading
Project Health Viz
Uncover new stories by visualizing healthcare data sets provided each month.
Web: Project Health Viz
Twitter: #ProjectHealthViz
October 2023: Customizing Shapes with Opacity in Tableau
Diversity in Data
An initiative centered around diversity, equity & awareness by visualizing provided datasets each month.
Web: Diversity in Data
Twitter: #DiversityinData
November 2023: Disney Demographics
Sports Viz Sunday
Create and share data visualizations using rich, sports-themed data sets in a monthly challenge.
Web: Sports Viz Sunday
Twitter: #SportsVizSunday
Viz for Social Good
Volunteer to design data visualizations that help nonprofits harness the power of data for social change.
Web: Viz for Social Good
Twitter: #VizforSocialGood
Real World Fake Data
Create business dashboards using provided data sets for various industries and departments.
Web: Real World Fake Data
Twitter: #RWFD
Session 6: HR Cross-Function Mobility
Makeover Monday
Create business dashboards using provided data sets for various industries and departments.
Web: Makeover Monday
Twitter: #MakeoverMonday
Data Plus Music
A monthly project visualizing the data behind the music we love!
Web: Data Plus Music
Twitter: #DataPlusMusic
相關文章
Meet Iron Viz 2024 Finalist Chris Westlake
 2024/04/22
DataFam Roundup: April 15–19, 2024
 2024/04/19
Meet Iron Viz 2024 Finalist Jessica Moon
2024/04/15
Subscribe to our blog
在收件匣中收到最新的 Tableau 消息。