Allrecipes, the world’s largest digital food brand, uncovers marketing trends with Tableau
Tailor content based on consumer behaviors
Deepen advertising and content marketing relationships
Device-level analytics grow mobile engagement
Allrecipes is the world’s largest digital food brand, serving a global community of 85 million home cooks across 18 web sites in 23 countries and 12 languages. With Tableau, Allrecipes can understand every stage of the customer journey. From analyzing web analytics to tracking content engagement, visual analysis allows them to spot and stay on top of emerging trends. Visibility into customer and web analytics helps Allrecipes reach dominant audiences like millennials, establishing a competitive advantage in the digital landscape. The team also shares audience-specific insights with media and advertising partners to support advertising partnerships while maintaining a positive brand experience for the Allrecipes community.
Without Tableau I think we'd be a lot less responsive. And I think, ultimately, we would be a lot less effective. Data allows us to build the best consumer experience, allows us to connect our partners to our consumers—and ultimately that results in audience development and revenue.
Encouraging community-driven marketing with Tableau
“At Allrecipes, it's actually easier to list out departments not using Tableau dashboards as compared to those that are. The dashboards are being used to inform nearly every business need,” says Esmee Williams, VP of Consumer and Brand Strategy with a smile. Tableau licenses are spread across product, design, marketing, editorial, finance, business intelligence, consumer strategy, and more.
“Everybody here is taking a look at the data to help move this brand forward,” says Esmee. “My team’s focus is to energize and excite others about the Allrecipes brand—and to help them better understand the wants and needs and food behaviors of our community of home cooks.”
The consumer and brand strategy team champions new features, partner integrations, along with customized marketing, editorial and promotional programs. To drive strategy, the team looks to the Allrecipes community for insights. With Tableau, they can understand community trends and behaviors and seamlessly respond to preferences.
“The Allrecipes community is so amazing. It is based-on millions of shared experiences through reviews, recipes, photos, blog posts, that have resulted in the brand and community that we have today,” says Esmee.
With Tableau, Allrecipes never has to guess at what home cooks want or need. They use data to discover desires and then inform product development strategy and marketing campaigns with their findings.
“Being able to access the data to see how our community responds really helps us foster tight alignment amongst the teams.”


As a marketer, it’s fantastic to be able to immediately see the responses and actions that consumers are taking.

Creating company-wide alignment
With Tableau, data is now readily accessible across Allrecipes. Automatic updates keep the data fresh, so teams can take action on emerging trends.
“The business impact from Tableau has been fantastic. It allows get our data out to internal audiences much faster in a way that is easily digestible to help them make more informed, strategic decisions,” says Esmee.
To share insights across teams, employees publish dashboards to Tableau Server, establishing one source of truth for company-wide data.
“With Tableau, our teams can leverage reports no matter where they are. They can collaborate, whether it's at their desk, in meetings, or on the go,” shares Esmee. “Tableau presents the data in a way that's very easily understandable so that folks can spend less time interpreting and more time acting on the data.”
“Now we can share information across the company, which gives everybody the confidence to know that we're all working towards the same goals,” explains Stan Paylovsky, President of Allrecipes.
Now we can share information across the company, which gives everybody the confidence to know that we're all working towards the same goals.
Improving brand experience with website analytics
The Allrecipes websites receive a billion and a half visits each year. With Tableau, the marketing teams can understand customer behavior on the site, track the health of the business, and monitor key performance indicators (KPIs).
“Knowing how consumers interact with branded content is so essential,” says Esmee. “The data shows us how home cooks interact with our products and experiences so we can continue to create new solutions to serve those needs. Tableau really helps them understand the context in which the product is used.”
Allrecipes brings in data from Adobe Marketing Cloud and demographic information from comScore and Hitwise into Tableau to create consumer behavior dashboards.
“We don't have to guess what consumers are doing or what they want, we can see it through their daily behaviors, and we use that to inform everything that we do,” shares Esmee. “We can look at how cooks are submitting and sharing content, and what sort of social sites they're pushing out their experiences. We look at food trends and what's the next, newest, best thing that folks are putting on their table.”
The marketing team uses these consumer insights to make tweaks to the website, improving the brand experience.
“As a marketer, it’s fantastic to be able to immediately see the responses and actions that consumers are taking based on changes or enhancements to the site. It helps us know when our actions are making a difference and gives us the confidence to determine next steps in our strategy.”

We don't have to guess what consumers are doing or what they want, we can see it through their daily behaviors...We can look at how cooks are submitting and sharing content, and what sort of social sites they're pushing out their experiences. We look at food trends and what's the next, newest, best thing that folks are putting on their table.
Optimizing video engagement with Tableau
When Allrecipes opted to establish aggressively expand their video catalog across their site, YouTube and social channels, teams needed insights into what types of dishes they should focus on first for maximum results.
Analyzing the data in Tableau, the Business Intelligence team determined dessert recipes—a highly visual form of content—resulted in more video views, user-contributed photos and comments.
Renny explains, “We used that information create a special, more prominent destination for dessert videos. We found that that hub was widely used by our users, and it was a good way to organize our video library.”
Instead of relying on intuition, the Allrecipes team can build content experiences informed by data. This contributes to the success of the site and saves the company time and money.
Trend data reveals millennial preferences
Allrecipes uses Tableau to uncover food trends, spot what’s most popular and fastest moving on a daily basis, and observe daily, weekly, monthly, and yearly changes.
“Tableau has definitely given us the opportunity to enhance audience development and increase revenues,” says Stan.
Esmee explains how this allows the team to understand new audiences like millennials:
“An interesting food trend that we're seeing right now is driven by millennials—a generation particularly focused on value. In a lot of ways, they're trying to stretch their food dollars. They're looking to the experiences of their grandmothers—who were also presented with finding budget-friendly meals during the mid-century.”
“To give you an idea of what that looks like, if you look at our dashboards today we can see that recipes for meatloaf, pancakes, waffles, and chickens with dumplings are all trending. What’s old is new again. And, of course, millennials put their own twist on everything. We've got amazing new recipe ideas for these dishes being published every day.”
With these audience insights, Allrecipes can segment audiences for each recipe type. This empowers them to deliver fresh, effective content faster than competitors.
“Understanding the data provides a high level of confidence that the direction we're heading with our vision, products, content and our services is spot on. To know improvement made will deliver a significant difference for our home cooks.”
Knowing how consumers interact with branded content is so essential. The data shows us how home cooks interact with our products and experiences so we can continue to create new solutions to serve those needs. Tableau really helps them understand the context in which the product is used.
Device-level analytics drive mobile engagement
Staying ahead of the digital landscape is crucial for a brand like Allrecipes. For both marketing and technology purposes, teams need insight into how the community interacts with recipe content across all devices.
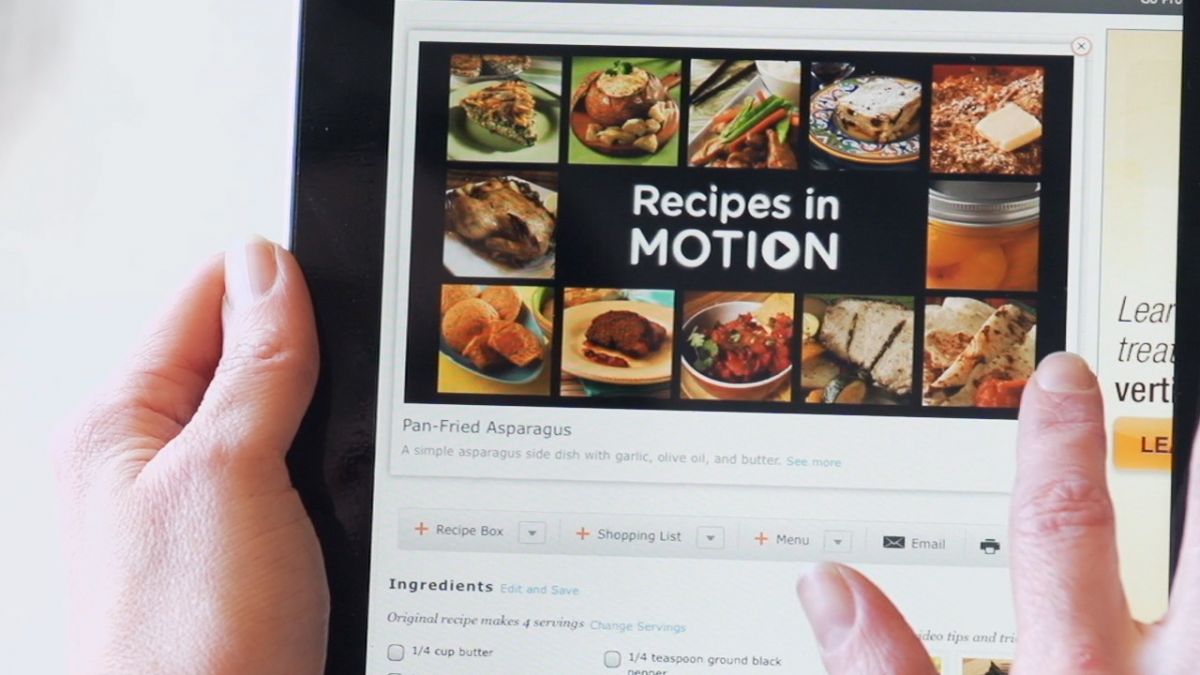
“There are so many new devices coming on the market every day. Tableau helps us understand how to share content with our home cooks across any device, whether he/she is planning, shopping, cooking or sharing,” shares Esmee. “Mobile is the biggest change to our business in recent years. A few years ago, we had 8 percent of our audience coming in from mobile devices. Today, mobile accounts for more than three-fourths of all visits.”
Allrecipes aims to provide a continuous experience across devices. A typical Allrecipes user may plan their meal from a PC or laptop, use their mobile device to shop for ingredients at the grocery store, and then use their tablet or voice technologies to guide them through preparing the recipe in their kitchen at home.
“Having access to the data with Tableau lets us understand each use case to serve a broad variety of needs in new and interesting ways,” voices Esmee. “It makes a huge difference when we are able to optimize for each screen.”
Business Analyst, Renny Sabina describes how Tableau dashboards revealed insights into consumers’ mobile behavior. The business intelligence team created an A/B test where they tested the Allrecipes mobile site on a tablet versus the desktop site.
“We saw some positive interactions. For example, people were uploading photos more efficiently because they have a camera on their iPad and they don't have that functionality on a desktop.” As a result of this testing, the team decided to optimize content for mobile, increasing user engagement.
With Tableau, teams have fast access to consumer data, allowing them to react to trends and serve audiences with the content they want and need—securing the loyalty of core audiences.
Having access to the data with Tableau lets us understand each use case to serve a broad variety of needs in new and interesting ways. It makes a huge difference when we are able to optimize for each screen.
Insight into holiday trends helps grow advertising revenue
Allrecipes collaborates with advertisers and media to enhance the site experience, leading to more effective advertising and as a result, stronger relationships with advertising partners. Using data, Allrecipes helps partners craft stories for their brands based on what’s trending in the marketplace.
“One of the coolest things that we've done with Tableau is create dashboards that help us share data to the media and advertisers, particularly around consumer trends during the biggest food holidays,” recalls Esmee.
For example, Allrecipes created a visualization in Tableau during the Thanksgiving holiday, allowing partners to understand what home cooks across the US were making for their Thanksgiving meals at a very granular level.
“We look to create content marketing opportunities for brands that enhance the consumer experience. Sponsored opportunities such as editorially-rich, content-forward landing pages, shopper marketing local offers, social posts and live videos provide inspiration to home cooks while keeping leading brands top of mind as consumers plan their next grocery shopping trip. And so we provide brands the opportunity to connect with our audiences at the time of need in a way that is additive to the home cook experience. Tableau helps us understand how well we're doing towards that goal and how our ad products are performing.”
Through these dashboards, the team discovered nationwide popularity on some recipes along with geographical preferences for certain regions.

“There are some certain dishes that are common across the United States, but when you look deeper into the data you can see very real geographical differences,” explains Esmee. “What a cook may call ‘stuffing’ in the northern states, is referred to as ‘dressing’ in the southeast, and whereas pecan pie is most popular say in Georgia, it's really about apple pie in Maine and Michigan.”
Both media and advertisers responded positively to these dashboards—allowing them to reach millions of home cooks with engaging and tailored methods.
“We were uniquely able to package and present data using Tableau that provided staff and partners a glimpse into tens of millions of American kitchens on the biggest food holiday of the year,” says Esmee. “Which excited them and helped them to create and share stories with their own audiences.”
This helps Allrecipes grow advertising revenues while maintaining a positive customer experience for their active community—creating a competitive advantage in the digital realm.
“Tableau creates a really great competitive advantage for Allrecipes because it allows us to provide the partners that we work with access to this data, very quickly, and in a way that they can very easily digest. They are as excited about the data as we are. It also helps us innovate more rapidly.”