Charting the Heart: Data Visualizations on Love


Hello, love! My name is Dzifa Amexo and I am a Tableau Social Ambassador and co-lead the BLK in D&A, NYC, and FinServ Tableau User Groups. My Tableau journey has been fueled by focusing on topics that are personally interesting to me whether it be around pop culture or personal quantifiable data.
At the end of 2022, I embarked on a personal project to track my dating experiences throughout the year, leading to a laugh-out-loud visualization that captured a rollercoaster of emotions. From the exhilarating highs to the inevitable lows, and 'It's Complicated' statuses of modern dating in a big city.
This specially curated collection of data visualizations includes insights into Valentine's Day spending habits, personal anecdotes from the dating world, the portrayal of love in media, and so much more. Each visualization provides a fresh perspective on the timeless theme of love.
This collection is designed for anyone and everyone—whether you're an anti-Valentine’s Day person, a die-hard romantic, or find yourself somewhere in the middle. It's a celebration of love, seen through the lens of data, and I invite you to join me in this exploration.
Click on each viz to visit it on Tableau Public, Tableau’s free online platform used to explore, create, and publicly share data visualizations.
Be sure to participate and check out visualizations shared this month for the February 2024 Datafam Con challenge around romance movies!
Dating/Relationships
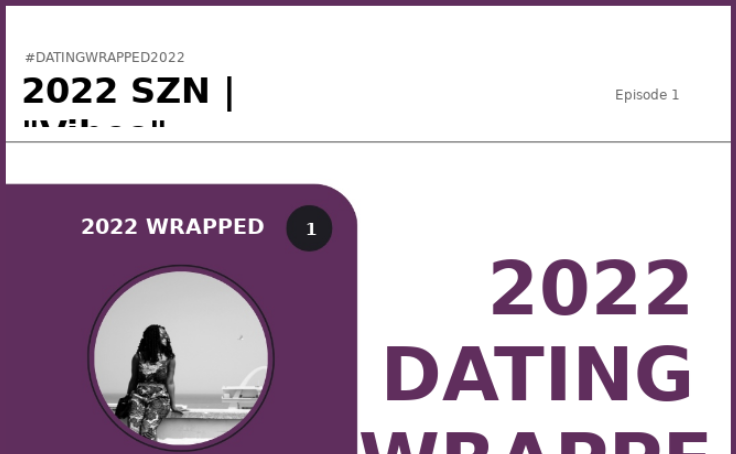
2022 Dating Wrapped
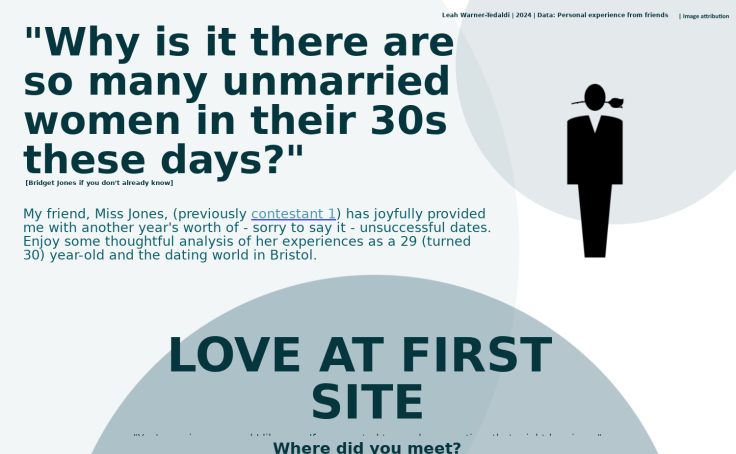
21 First Dates | An Early Valentines
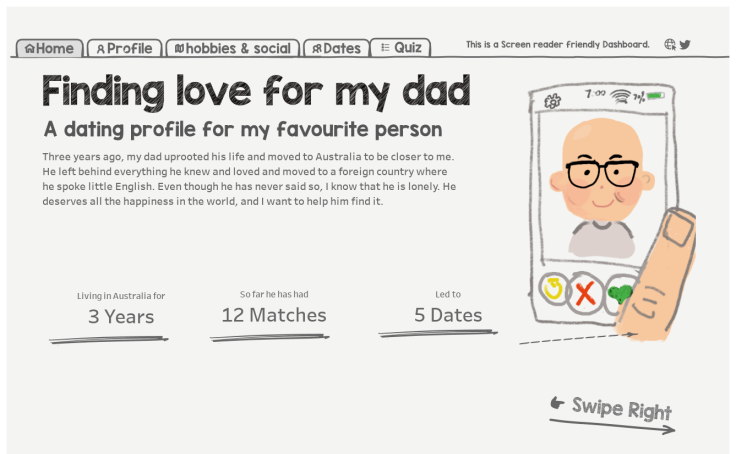
Finding Love for dad
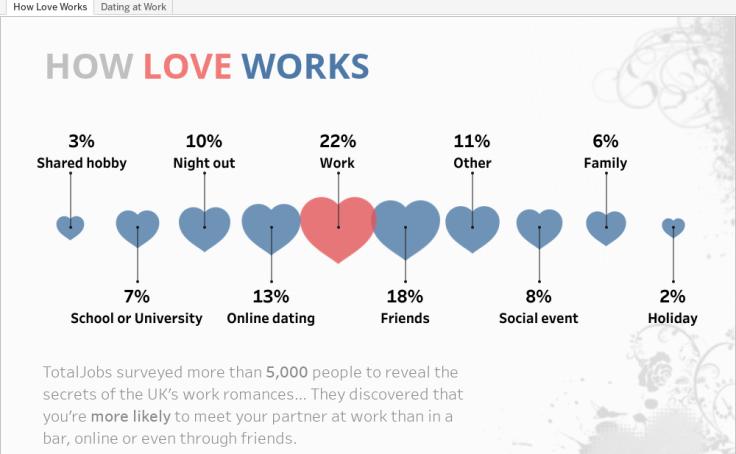
How Love Works
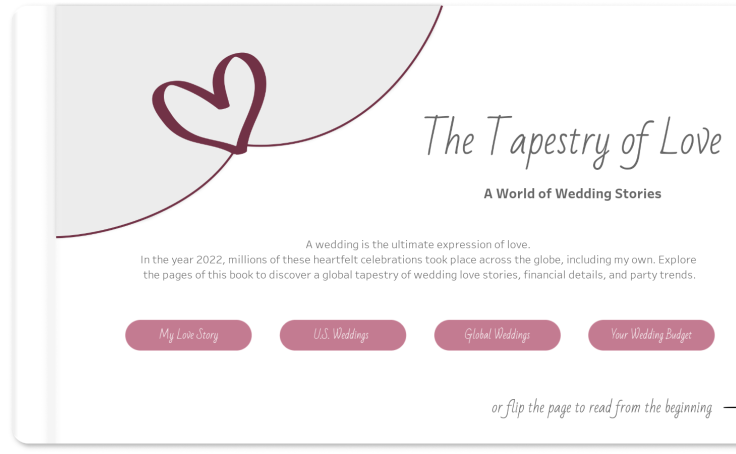
The Tapestry of Love | IronViz Submission 2023
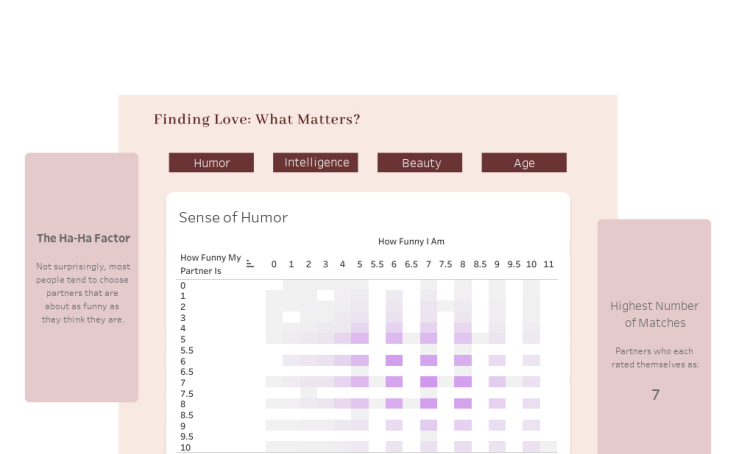
Finding Love: What Matters?
Valentine’s Day
Valentine's Day #votd
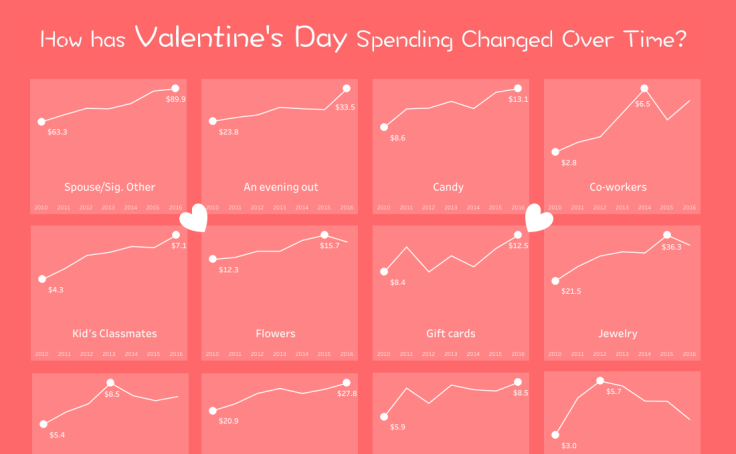
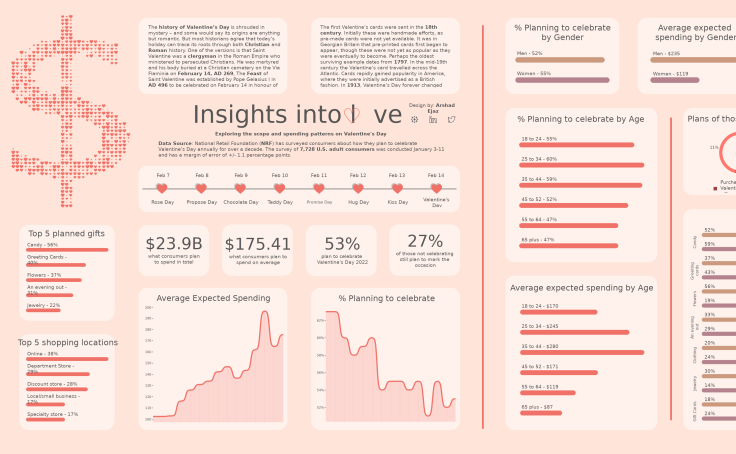
Valentine's Day Spending!
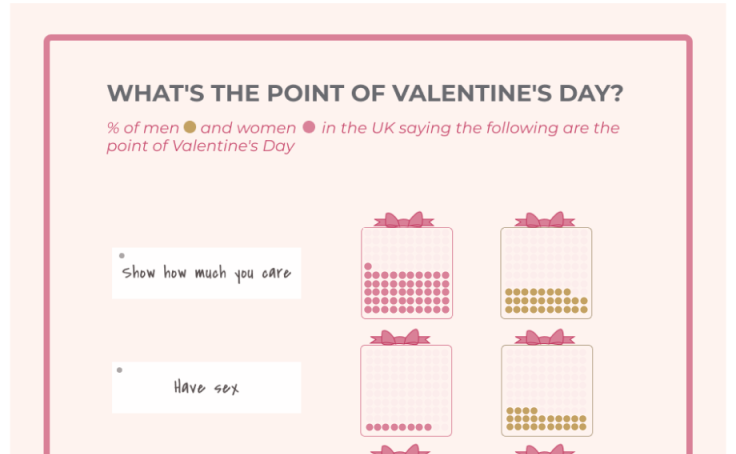
What's the point of Valentine's Day
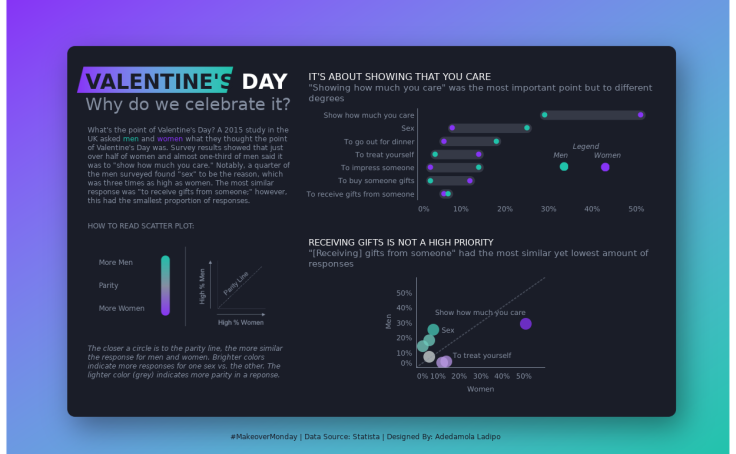
#MakeoverMonday | 2021 WK7 | Why Do We Celebrate Valentine's Day?

Create Your Own Valentine
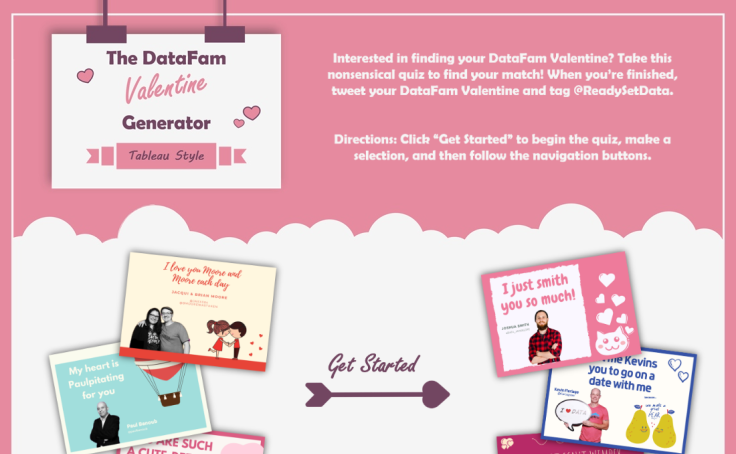
DataFam Valentine Generator
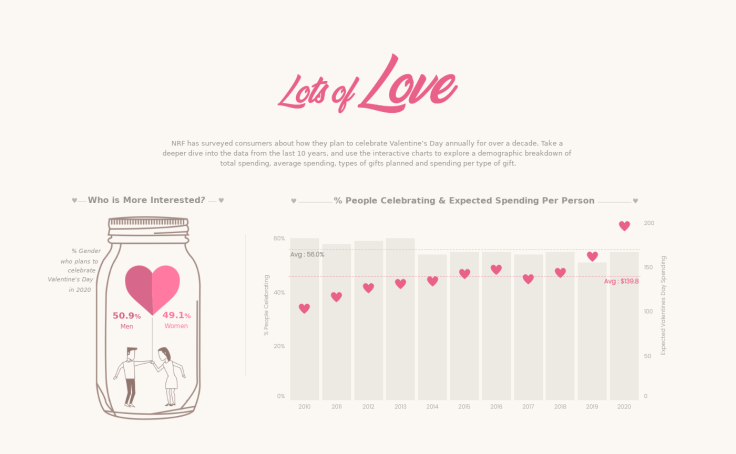
Lots of Love
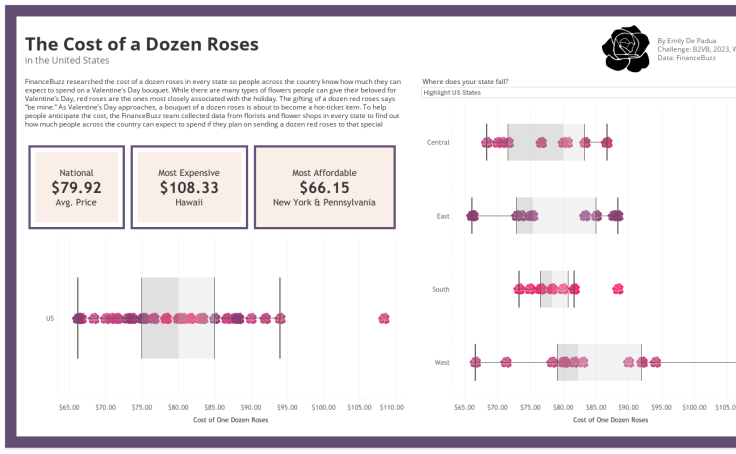
The Cost of a Dozen Roses
General Love/Valentine’s Day Adjacent
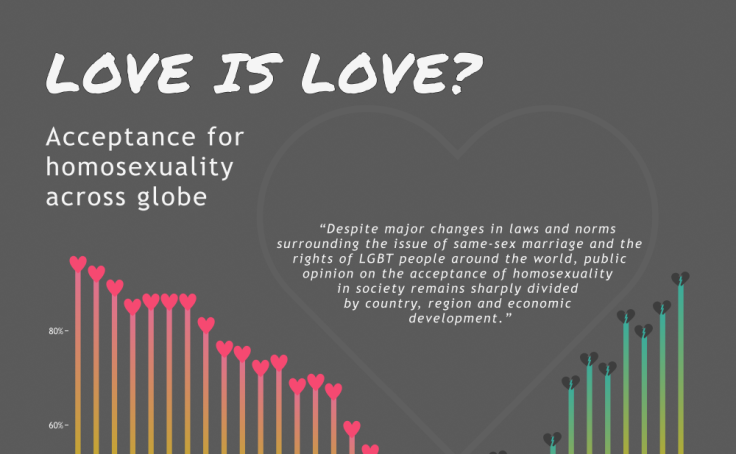
Love is Love? #B2VB
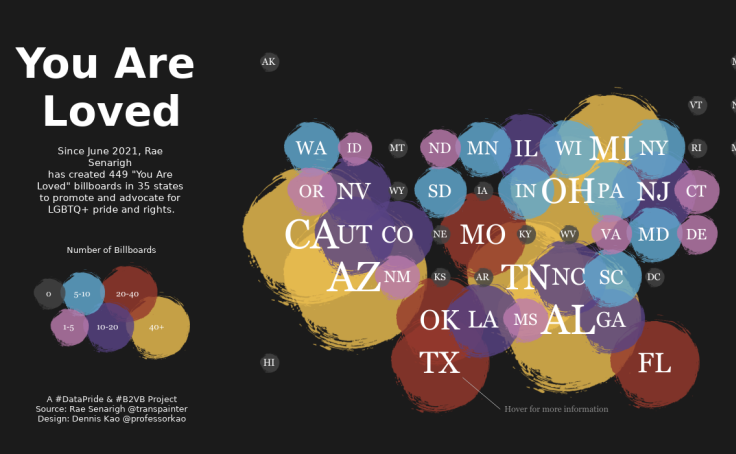
You Are Loved Billboards
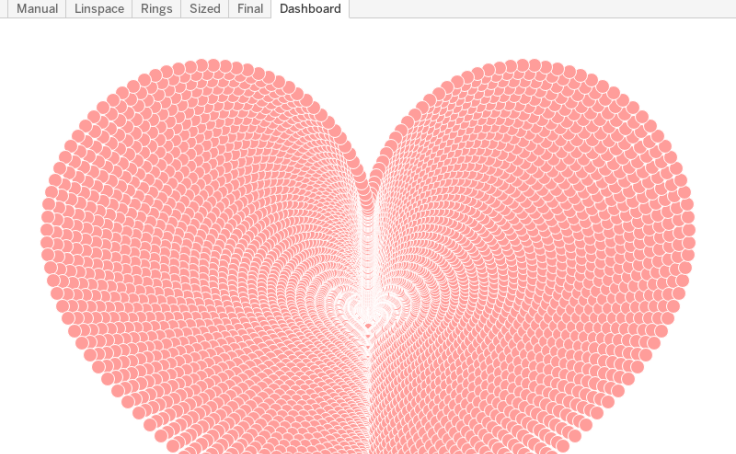
Creating a Heart in Tableau
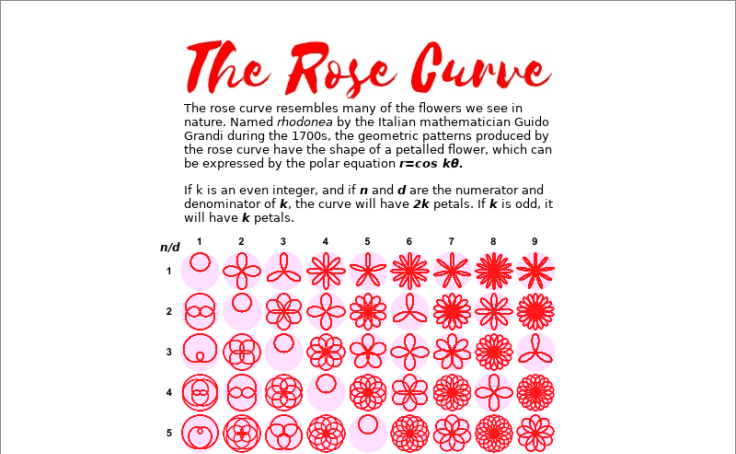
Visualizing the Rose Curve
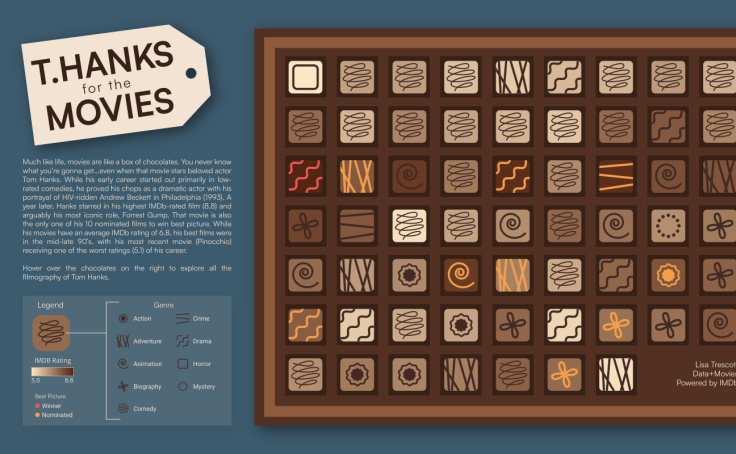
T.Hanks Movies | #VOTD

A Family Portrait of Love Languages
Love in the Media
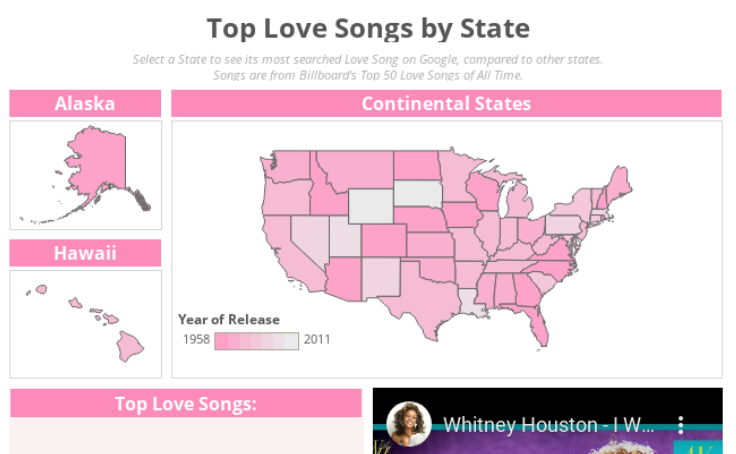
Top Love Songs by State
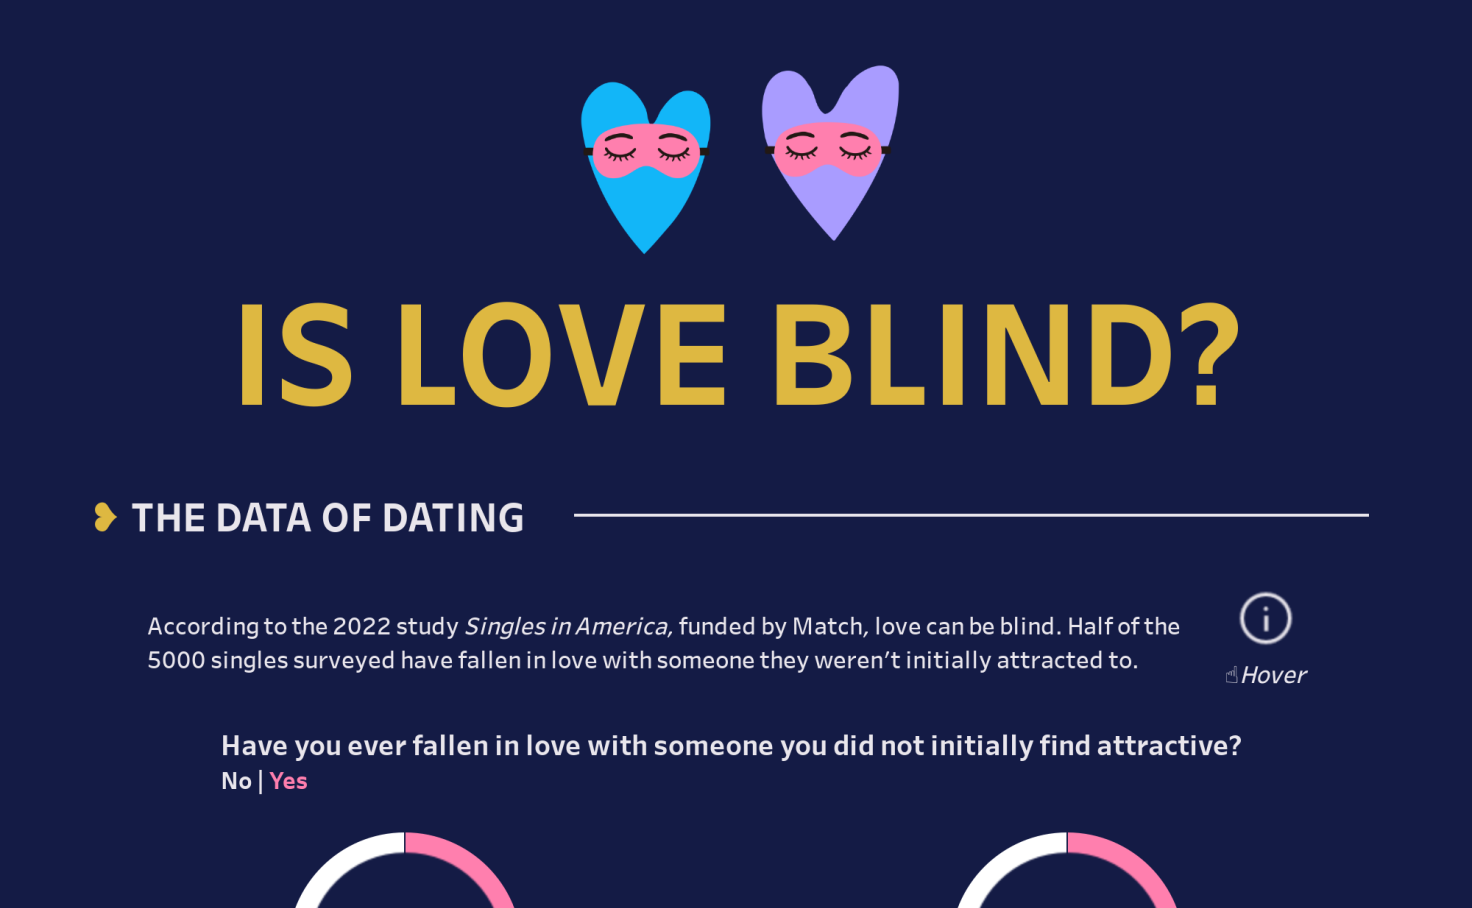
Is Love Blind?
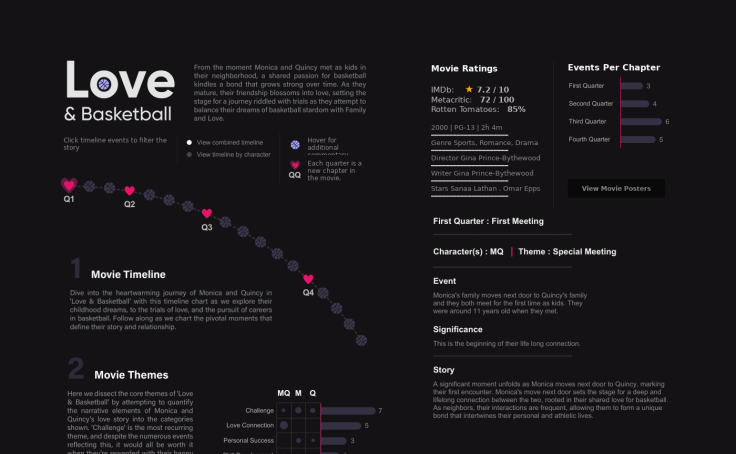
Love & Basketball

Reply 1988
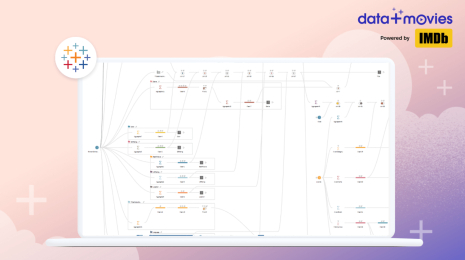
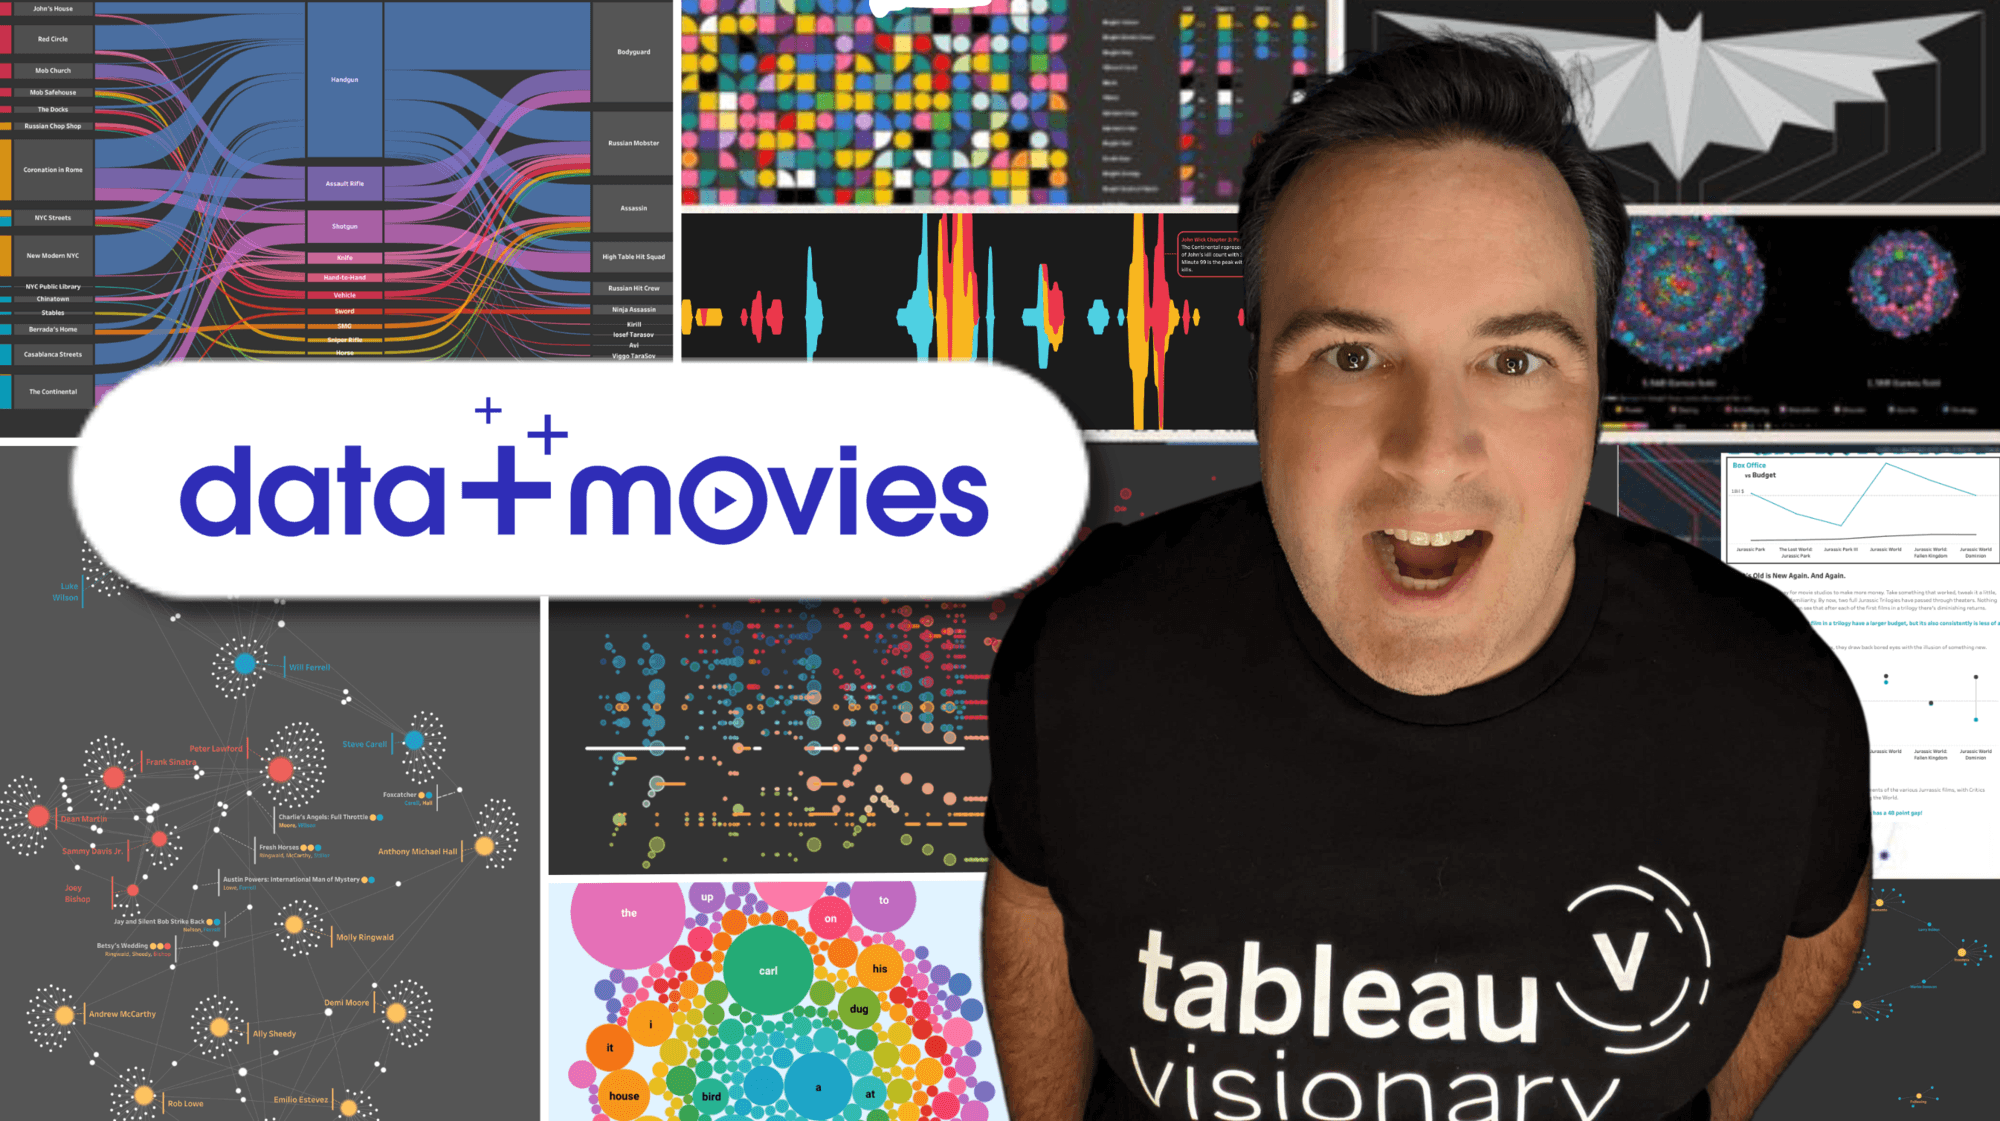
Take viz inspiration and put it into practice. If you love movies, join in on Tableau's Data + Movies challenge. Learn how to create your own data visualization based on the movies you love using data from IMDb. Take the challenge.
Related Stories
How I Learned Tableau Prep with Data + Movies
 March 27, 2024
How to Get Ready for the Next Iron Viz Competition
 September 28, 2023
Subscribe to our blog
Get the latest Tableau updates in your inbox.