Tableau Pulse: Proactive Answers to Your Common Business Questions with Automated Insights


The word “insights” gets a lot of buzz in the business world these days. But what does it really mean?
Automated business insights help decision makers know where, when, and why to focus their attention on a critical metric or KPI. In Tableau, insights have historically been delivered in dashboards and workbooks via features like Data Stories and Explain Data. Now—with Tableau Pulse—insights are making their way into the flow of work.
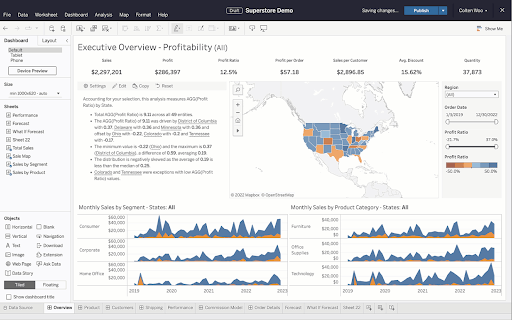
Tableau Data Stories automatically delivers insights that answer business questions in Tableau workbooks. Now with Tableau Pulse, insights are making their way into the flow of work.
What are automated business insights and who are they for?
Before talking about what insights are, it’s important to first ask who they’re for. Seventy percent of business users today—whose job may be in marketing, sales, finance, and HR, and so forth—are still underserved with data and analytics. These are the people who are not in data, don’t have “data” or “analyst” in their titles, but still need to make data-driven decisions fast by asking the right business questions.That said, you can think of insights as automated answers, alerts, or suggested actions to common business questions around the Tableau Pulse Metrics that matter to these business users. In Tableau, the Insights platform and the Metrics Layer—a global glossary of your metrics, KPI definitions, and relevant business contexts—are aligned, so every insight surfaced is grounded in real-time data on the metric in question.
But surfacing relevant business insights is only the first step. The next is delivering them to the decision makers who need them—where and when they need them. This is key to enabling data-driven decision making at an organization-wide scale. But it’s not as straightforward as it sounds, because the expectation for how insights are delivered has changed.
In 2023, Gartner reported that 47% of digital workers struggle to find information or data needed to effectively perform their jobs. Users now expect to access insights in contexts beyond dashboards, much like they appear in the consumer apps they use for tracking personal metrics (e.g., fitness apps surfacing insights like “Step Count is +738 steps/day compared to last month”). In a business context, this means providing insights in the domain-specific apps such as Salesforce Revenue Intelligence, for example—or in the flow-of-work apps they use daily, such as Slack and email.
The Tableau Pulse Insights platform
So how does this support business users? Tableau Pulse Insights platform generates and packages insights that answer common questions they have about the Tableau Pulse metrics they’re following or viewing. It processes its findings in natural language—enhanced with AI—and delivers them to users in Tableau Pulse in the forms of summaries, via guided conversations, and in the flow of work.
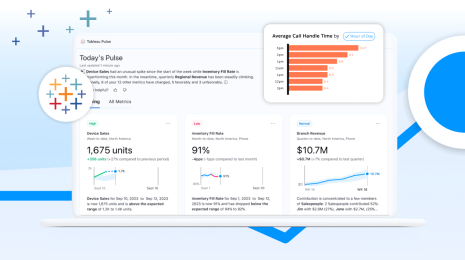
Examples of Insights platform answering common business questions about Pulse Metrics throughout the Tableau Pulse experience.
Insights via guided conversations
Business users ask business questions, not data questions—and abstracting beautiful visualizations from data alone to answer bespoke user queries does not satisfy their needs in the long term. Imagine: You are a sales leader for the Pacific Northwest region, and you wonder “which product category is driving the latest sales figure in Washington?” Would you want to type in that query or slight variations every single time, hoping the system is smart enough to answer it correctly and consistently? Would you want to explore multiple dashboards, only to find contradictory answers because of the data context and your way of filtering?
Or would you simply want an answer that is crisp in response, trusted in nature, and that directly answers the question you care about—complementing it with visuals for better understanding?
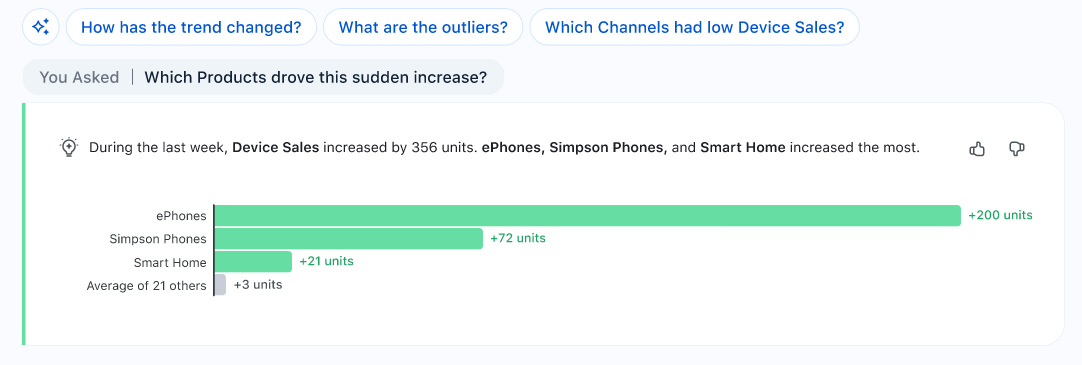
Tableau Pulse Q&A answers the business question “What products are driving the sudden increase in Device Sales I am seeing”?
Tableau Pulse Q&A takes this last approach. Via a simple point-and-click experience, it uses a conversational interface native to the Insights Exploration page, allowing business users to progressively reveal insights in the context of their metric. Users see a natural language insight accompanied by a visual explanation each time they ask a guided question that represents what the insights convey.
This lifts the burden of asking the right question, brainstorming how to phrase, typing it in, and even worrying about whether to trust the answer based on how you filter and interpret the data.
Serving insights via these conversations makes the analytics end-user experience more intuitive, engaging, and rewarding. The best part is, this solution is available out-of-the-box today as a part of the Tableau Pulse experience.
Insights Summaries for the Metrics you’re following
Business users don’t have time to interact with every single metric they’re following and uncover every possible insight to understand what is happening and what they need to do. Instead, they need a way to quickly reap the benefits of the metrics created and the insights detected—as fast as skimming over an easy-to-read piece of text.
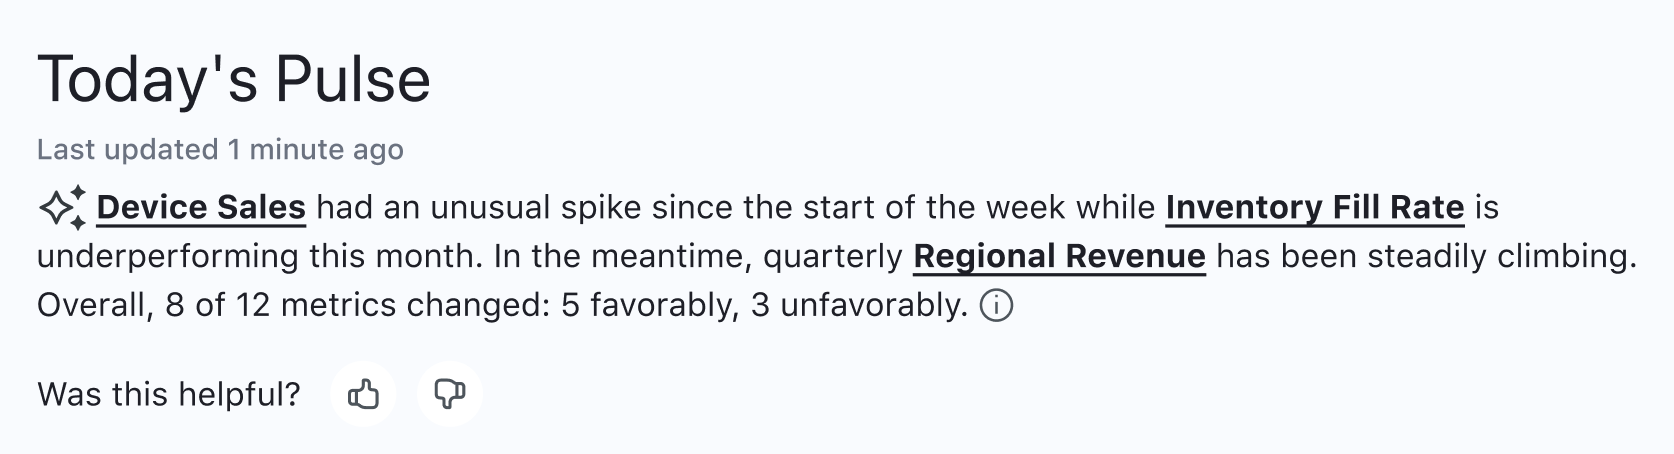
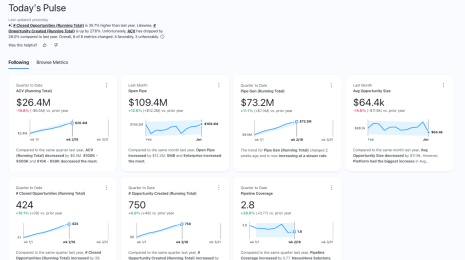
Insights Summaries like this help business users understand the important changes to the Pulse Metrics they are following.
That’s what the Insight Summary is: personalized, AI-generated, natural language summaries of key insights derived from the metrics a user follows. Insight Summaries are available in various locations throughout Tableau Pulse, providing users a quick, easy overview of their latest metric performance across the board. This saves the time and energy required to decide which changes matter most and require their attention before diving deeper into the root cause.
Insights in the flow of work, Slack, email, and Tableau Mobile
Business users don’t have the time to dig into multiple dashboards to find what they need, and the same holds true for Metrics and Insights. Serving them upfront and directly in the flow of work is crucial to enable decision making and action in real time. That’s why Insights and Summaries have a larger footprint outside the Tableau Pulse web application.
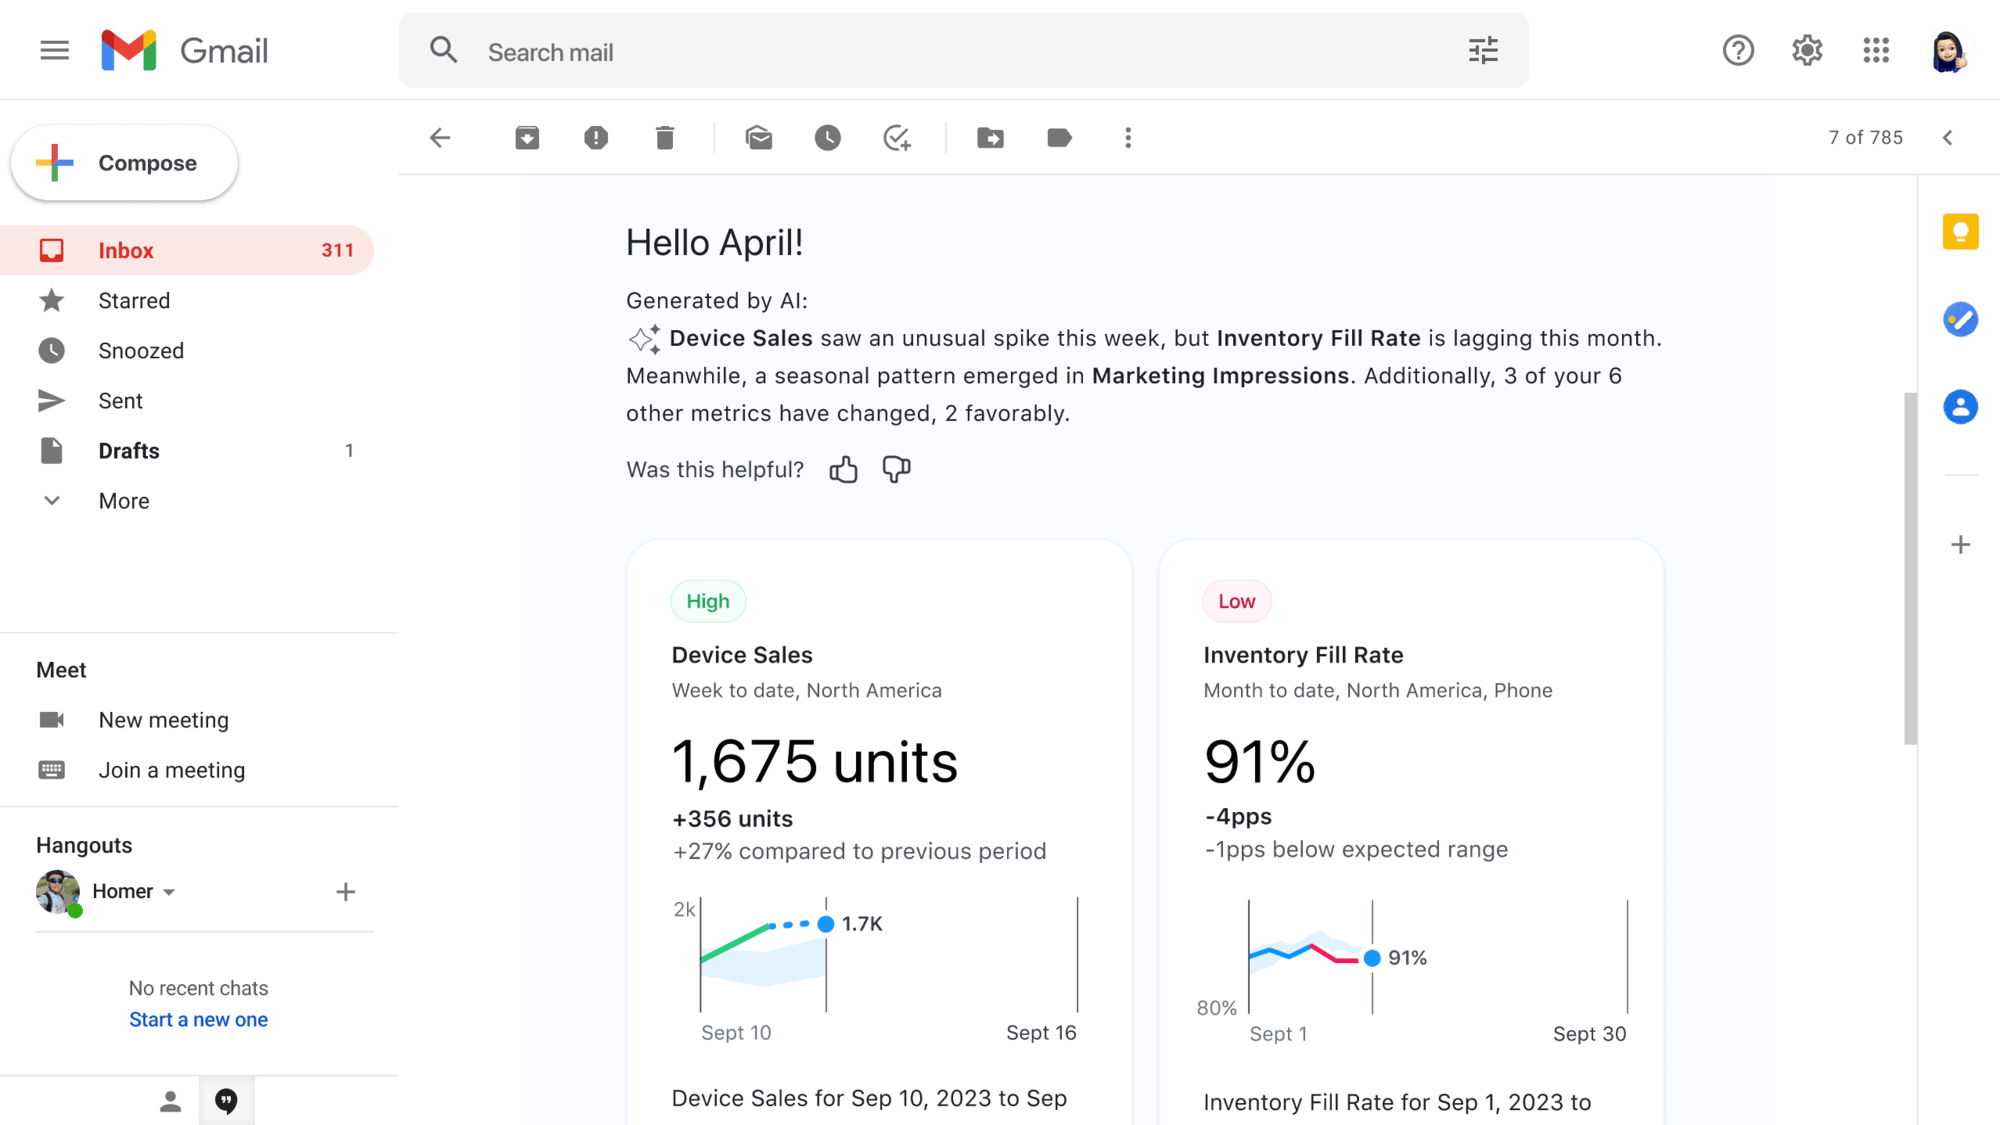
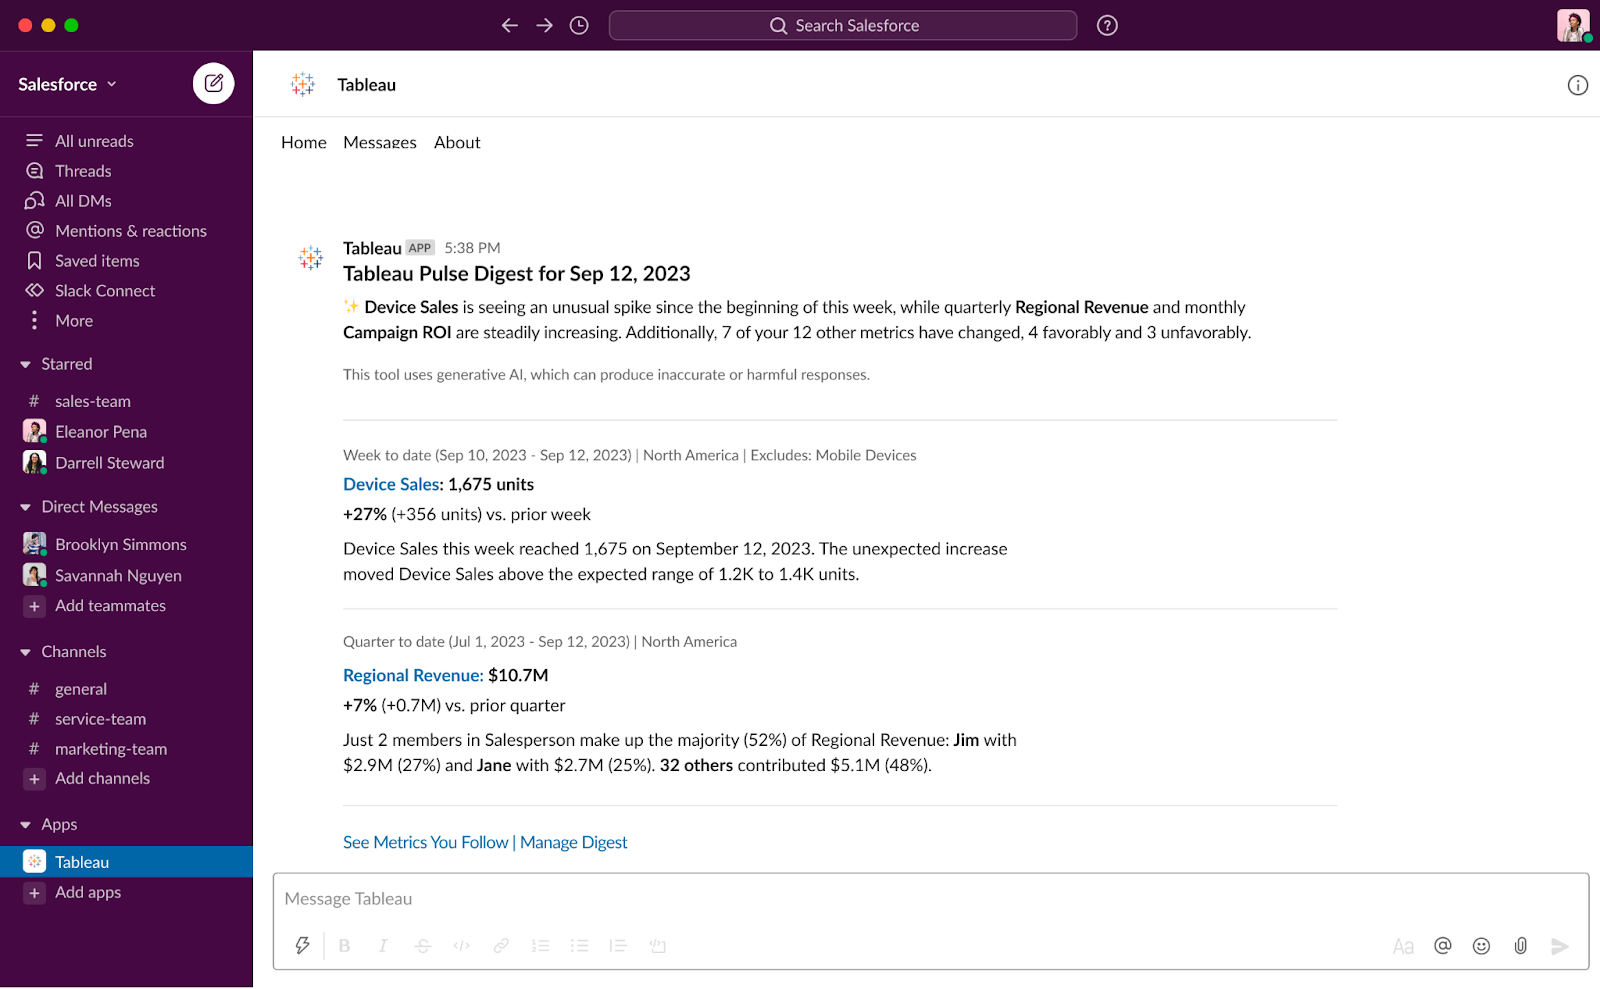
Insight Summaries, along with the top-ranked insight for each metric the user is following, are proactively delivered to users in the Metric digests they receive in email and Slack.
For instance, the same Insight Summary users see on their Metrics homepage is also available as the first thing they see in their Slack, email, and Tableau Mobile apps—providing the context and intent to dig deeper as they wish. Furthermore, the most important insight detected for each metric the user follows is also provided so users can stay on top of hidden patterns or changes for each Metric, where they are and when they need them most.
What questions do the Insights platform help answer for Tableau Pulse Metrics?
The questions users typically ask about metrics can be grouped into well-known patterns of analysis, which analysts manually perform for the business users they support. These include:
- Descriptive questions: What happened to my Metric?
- Diagnostic questions: Why did it happen?
- Predictive questions: What is likely to happen next?
- Prescriptive questions: What actions should I take?
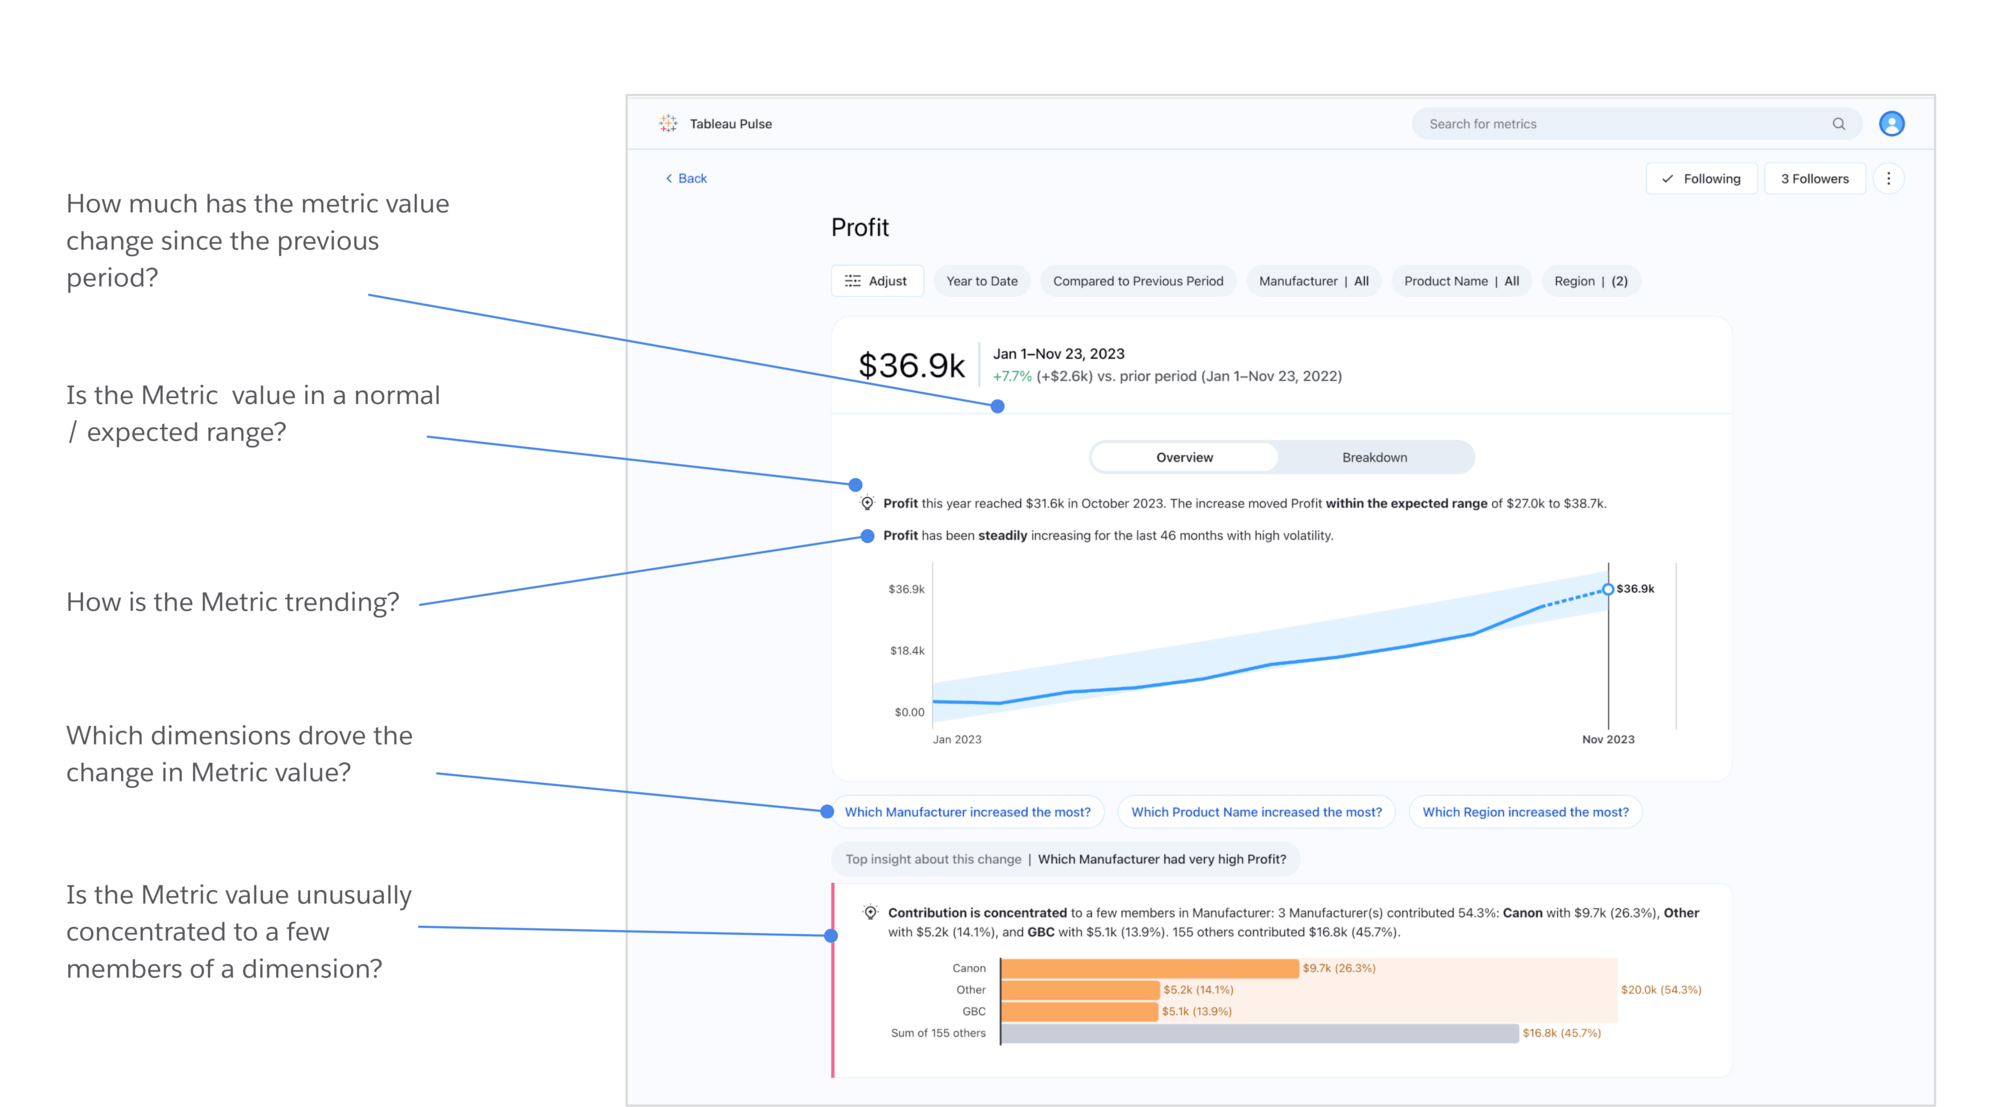
To start, the Insights platform focuses on helping users answer basic descriptive questions they have about Pulse Metrics, such as:
- How much has the Metric value changed since the last period or the same period last year?
- How is the Metric trending over time?
- Which members of a dimension contribute most to the Metric value?
- What other dimensions are driving the Metric value in a favorable direction?
In addition, the Insight platform can alert users to hidden changes or anomalies in Tableau Pulse Metrics so they can better diagnose issues. For example:
- Is the Metric value higher or lower than normal?
- Is the Metric value unusually concentrated in a few entities of a dimension?
- Has the trend of the Metric changed recently?
- Are there any unusually large/outlier records that are impacting the metric value?
As the Insight Platform evolves, it will extend to automatically answer predictive and prescriptive questions as well.
How does Tableau Pulse generate and maintain trusted insights?
Over the years, analysts have spent countless hours curating, testing, and publishing dashboards to provide users with trusted answers to their questions. But in an environment where the analysis happens automatically, how can users trust the insights the Insights platform detects so they can confidently make business decisions based on them? Here are a few ways the Insights platform generates automated business insights users can trust:
- Tableau Pulse Insights Service starts by using standardized, deterministic statistical models to detect facts about Metrics that are guaranteed to be accurate. These facts act as the ground truth when generating insights
- All insights generated are restricted to the data security context (i.e., RLS settings) of the user who made the request ensuring the person can only see the data they are authorized to see
- Analysts have the ability to enable/disable the different insights being detected for a metric so they can control what is delivered to their users
Here’s how Tableau Pulse brings it all together: the Insights platform's statistical service uses the analytical context of the metric being followed or viewed to run automatic statistical analysis that generates facts about the metric. These facts answer the different questions using the user's data security context. The most relevant facts are then processed by AI, which uses them as ground truths to contextualize language generation—creating summaries with highly consumable language, for instance, that are grounded in statistical truths. The resulting facts generated are bundled together and surfaced in several features throughout Tableau Pulse as insights.
How does the Insights platform ensure relevant insights for users?
To best manage the attention of users, Tableau Pulse only surfaces the most relevant, useful insights—and does not spam them with noisy or spurious findings. If the signal-to-noise ratio is off, users will ignore these insights.
The Insight platform takes several steps to ensure the insights users see are relevant and useful, including:
- The analytic context for Insights is based on the Tableau Pulse metric definition. Unlike other solutions that look for insights across all columns in the data, the Insights platform restricts its analysis to the measures and dimensions referenced by the metric definition, as curated by analysts. In addition, only the filtered context of the metric the user is viewing or following is considered when generating insights.
- Insights are ranked based on impact to the metric. Each fact detected by the Insights platform is scored based on the impact it has on the metric value. Only the facts determined to be most statistically impactful to the metric value are returned first.
- Thumbs up/down feedback further personalizes insights. Users can provide thumbs up/thumbs down feedback on the insights they see to indicate whether or not they are useful. The Insights platform learns from this to further personalize the types of insights it shows to a user.
When applied in combination, these steps ensure that of all Insights detected for a metric, only those found to be most useful are surfaced to users in Tableau Pulse.
Learn more about the Tableau Pulse Insights platform
As the Insights platform evolves, Tableau Pulse will bring more types of insights to life that answer critical business questions for business users throughout the Tableau Pulse experience. Watch the demo to see how the Insights platform in Tableau Pulse powered by Tableau AI comes to life.
Related Stories
How Tableau’s CRO Uses Tableau Pulse
 March 11, 2024
Now Available in 2024.1 Release: Tableau Pulse, Metrics Layer, Viz Navigation, and More
 February 22, 2024

Tableau Metrics and Natural Language Query Evolve with Tableau Pulse
 February 21, 2024
Subscribe to our blog
Get the latest Tableau updates in your inbox.