
Expanded Self-Usage of Tableau Produces Several Examples of Operational Improvements
18,000 Hours Saved on Workforce Management and Approx. 96% Reduction in Personnel with Long Working Hours

Background to Implementation
Sales Data Analysis as the Forerunner to Data Democratization
At Hitachi in recent years, the Digital Systems & Services Headquarters that has jurisdiction over the financial business unit, social business unit, and others in the IT sector led so-called “data democratization” efforts by building an environment in which anyone is free to utilize various types of data. These efforts enabled employees in various departments who are not IT experts to also look up, process, and analyze data independently and use it to create new businesses or reform operations. For this purpose, the Headquarters provides departments with self-service tools and training environments as well as coaching and other support.
Yoshiyuki Tagawa is General Manager of the Group IT Strategy Department in the IT Innovation Division of the Digital Systems & Services Headquarters. He explains the context in which these initiatives began as follows. “Compared to other departments, there are a lot of engineers and other personnel with high IT literacy in the Digital Systems & Services Headquarters, but their interests were mostly directed at customer-oriented operations like development and customer solutions. Therefore, there was generally low interest and literacy with respect to data utilization in workforce management, project management, and other internal operations.”
Facing these issues, a particular project prompted Hitachi to begin considering the implementation of data analytics tools. Taiiki Niwa of the Digital Innovation Department reflected as follows. “We were tasked with assisting sales data analysis for a Group company that handles construction equipment, but being outsiders to that field, we did not know anything about that type of work. Since we first needed BI tools in order to understand the work and the data, we began using Tableau on a provisional basis.”
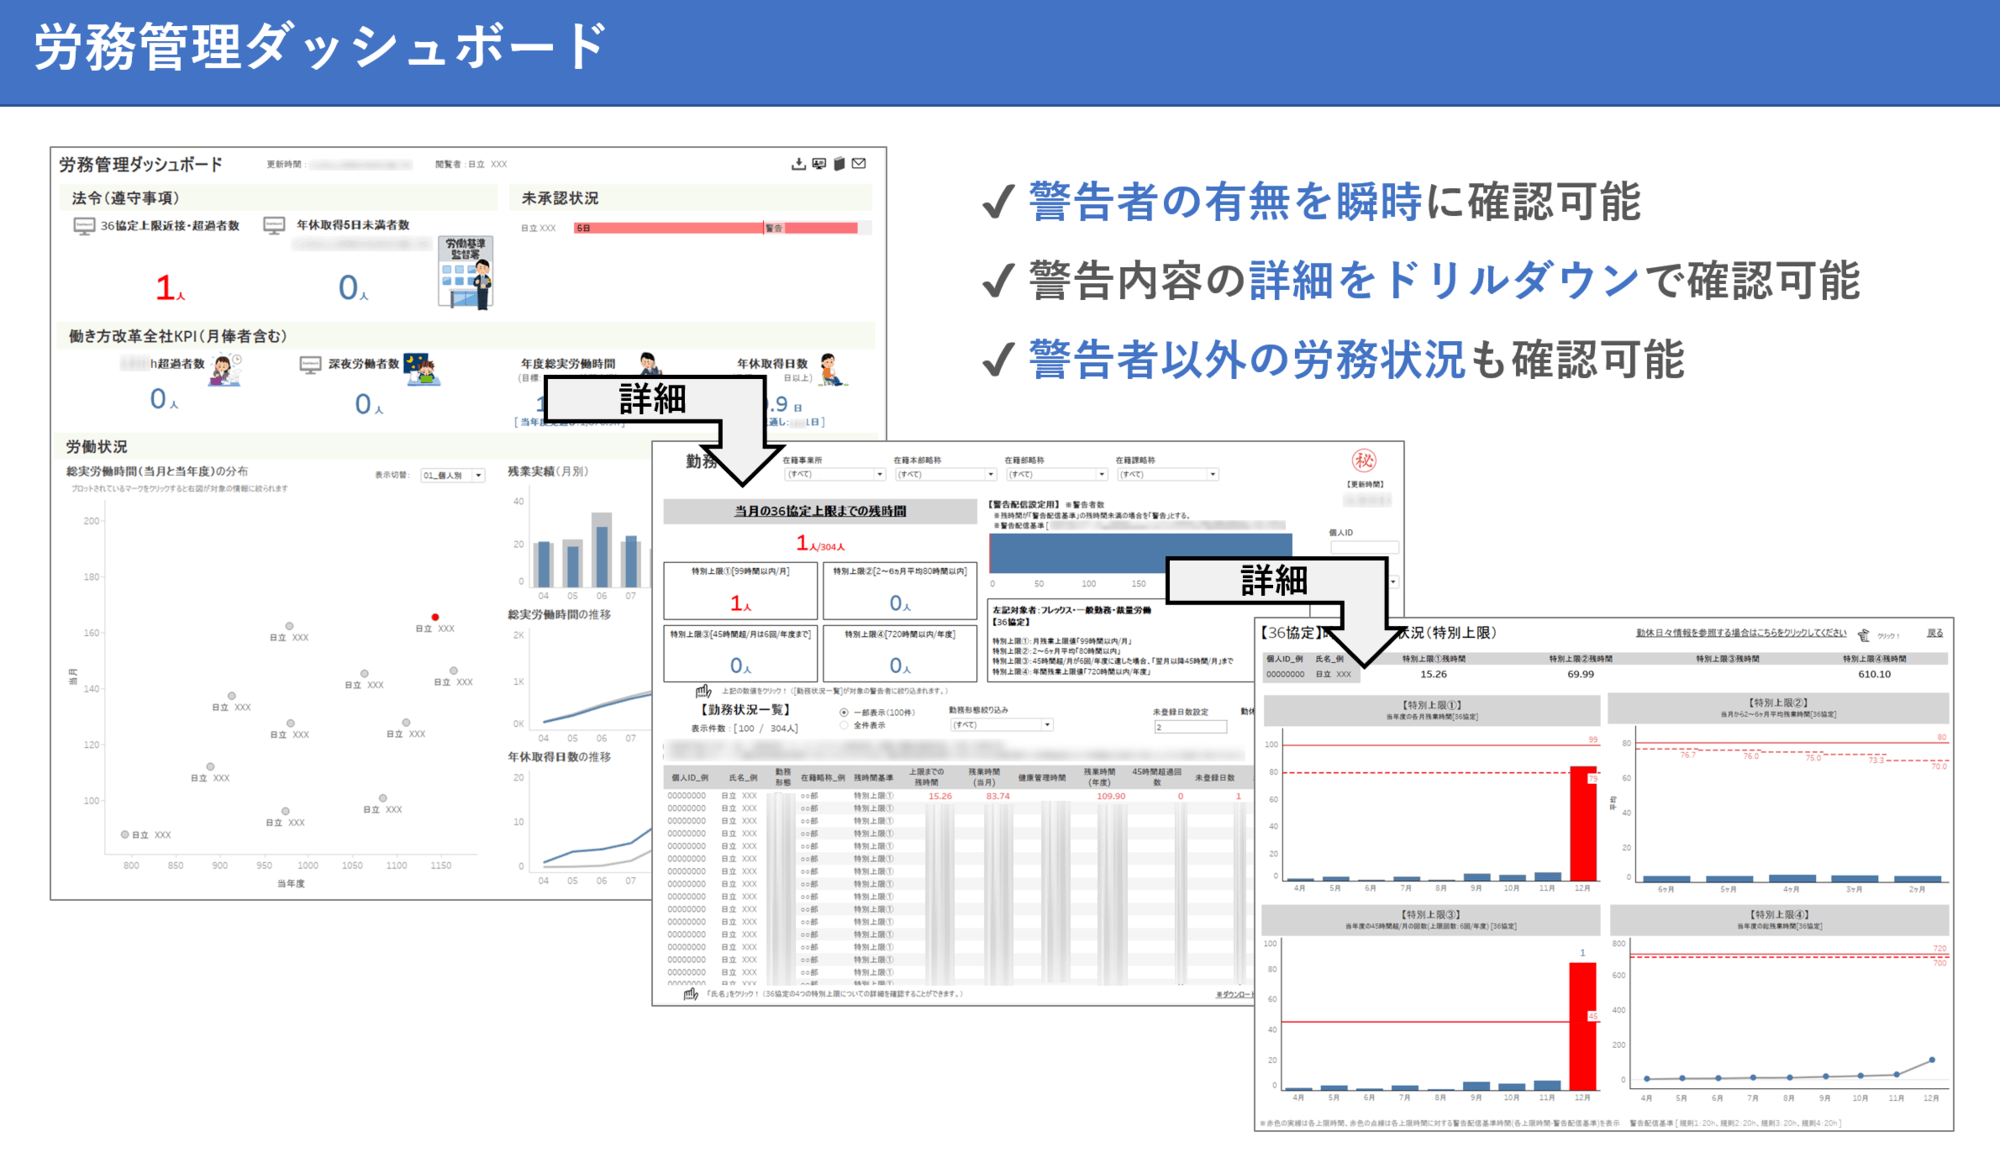
Tableau Implementation and Operation
Tableau Usage Expanded Rapidly with the Workforce Management Dashboard
Niwa’s team implemented Tableau in order to perform customer targeting analysis. Utilizing analysis of vast amounts of sales data, they built a mechanism for creating lists of customers with a high likelihood of making purchases so that they could be efficiently targeted for in-person visitation, and this strategy produced huge results. That was one of things that kicked off “data democratization” in the team.
The next thing to boost familiarity with Tableau within the company were the dashboards used to visualize and manage employees’ work status. The Workstyle Reform Law, enacted in April 2019, strengthened the upper limit on overtime and thereby further raised the importance of monitoring work status. Niwa’s team determined that this would be a great opportunity to make Tableau usage commonplace within the company. They created a dashboard that enables anyone to understand at a glance the current state of key work status data that need to be managed, and deployed that dashboard throughout the entire company.
Moreover, they also began holding regular hands-on seminars so that users could learn through experience that Tableau enables even people without specialized knowledge and skills to easily visualize various data and put them to use in business. In the year-long period from Tableau’s implementation to October 2019, these efforts grew the number of Tableau Explorer users to around 80 and Tableau Viewer users to around 11,000. In 2022, these numbers grew to around 370 and 21,000 respectively. Niwa explains as follows.
“Tableau is a tool used in work operations, but one of its most appealing features is that it is also capable of endless variations of graphical visualization that make it fun to use and help you understand how to properly express data. We really get feedback to that effect from users as we help them implement Tableau, and I think that is a major contributor to the spread of usage of the tool in the company.”
Why Tableau?
Deciding Factors: Ease of Visualization, Speed of Analysis, and Clear Output
In the process of selecting a BI tool, the Digital Systems & Services Headquarters apparently researched and conducted hands-on comparisons of every major product on the market. They chose Tableau, and Niwa explains their reasoning as follows.
“We felt that Tableau was superior in many respects, from easily visualizing data to quickly analyzing data from a variety of perspectives and rendering the results as a visualization that anyone can easily understand. Then we actually tried out various BI tools in analyzing the Group company sales data as mentioned before, and once we found that Tableau projects produced the biggest results, we decided to implement Tableau.
“Moreso than simply showing the results of data analytics to Group company members, I felt it was far easier to convey information by using Tableau to visualize the data on the spot and show those visualizations right then and there.” That, he said, is why they chose Tableau.
Through this process, Hitachi launched the full-fledged implementation of Tableau with the support of Hitachi Solutions, a Tableau reseller partner.
Tableau offers endless variations of visualizations and can be easily used even by people with poor visualization skills, making it more fun to use the more time you spend with it. I think it is incredible how, as you dig into data that interests you, that data is automatically visualized so you can understand it better.

Benefits of Tableau Implementation
18,000 Hours Saved on Workforce Management and Approx. 96% Reduction in Personnel with Long Working Hours
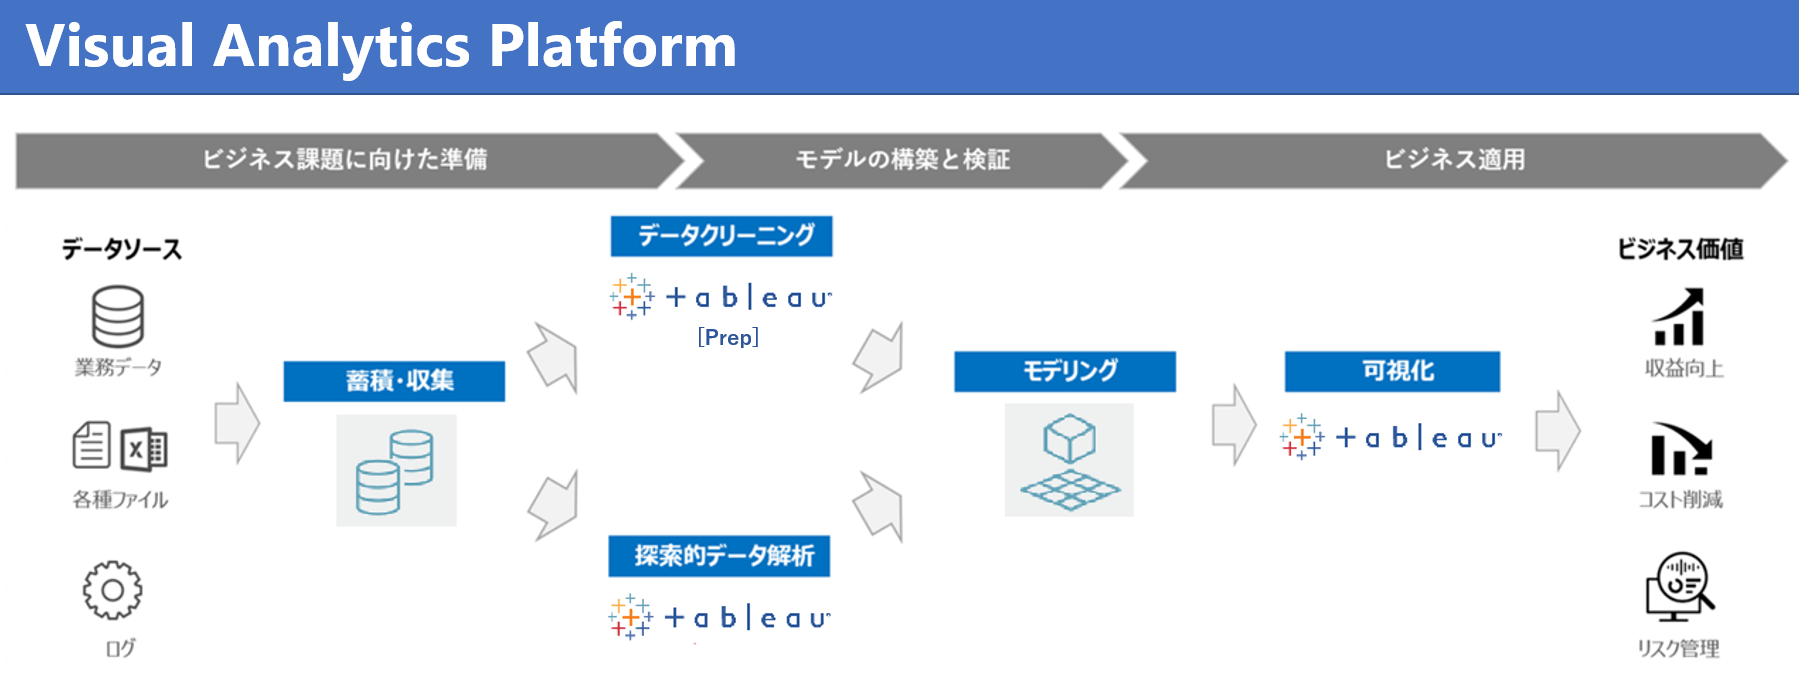
By establishing and deploying a Visual Analytics Platform (VAP) centered around Tableau and creating an environment in which individual personnel who are not IT specialists can analyze data and incorporate it into their activities themselves, one example after another emerged from in and around Hitachi of data-empowered improvements to work operations.
For example, operational departments themselves used Tableau to create a system for managing and sharing project information and the quality status thereof, a system for providing engineers with data and knowledge, and other such systems. Group companies are also stepping forward to begin using Tableau as a platform for visualizing and sharing data on business performance, projects, human resources, labor affairs, and other matters. “Data democratization” aimed to enable all employees to be able to freely make use of data, and this is actually becoming a reality.
The impact of Tableau implementation is also clear in the quantitative data. In FY2021, the Workforce Management Dashboard was accessed around 110,000 times throughout the year, which works out to 18,000 hours saved on workforce management. Niwa adds the following comment with respect to these results.
“Although the reduction in man-hours spent on workforce management is important, even more important is reducing the number of personnel working long hours. We believe the biggest outcome of all to be the fact that we managed to reduce the number of personnel working long hours by around 96% compared to FY2018, before Tableau was implemented. At present, we are working to further expand Tableau usage by deploying dashboards that enable users to instantly see the work status of each employee and detect concentrations of overtime.”
From a small start, Tableau enables us to perform agile development that makes improvements while incorporating user feedback, so we are both more in touch with the front lines than before and engineers’ work styles themselves have also changed significantly

Future Developments
Tableau Expected to Make Major Contributions to Sales and Marketing Fields
By implementing Tableau and creating an environment in which anyone is able to utilize data, Hitachi in steadily pushing ahead the cause of “data democratization.” Tagawa describes future deployments that will further accelerate Tableau usage as follows.
“The role of the Digital Systems & Services Headquarters is to boost earnings and company growth through data utilization, so we next want to focus on sales and marketing, which are currently white space for us. We expect that Tableau will be an extremely powerful tool in our arsenal during those initiatives because of its ability to easily link up with various other tools and APIs. As it is a tool that benefits even our customers, we want to spread Tableau usage beyond just the Digital Systems & Services Headquarters and even Hitachi to include the entire Group.”